
Cheng JIANG, Gui-qian TANG, Qi-hua LI, Bao-xian LIU, Meng WANG, Yue-si WANG. Vertical Profile of Aerosol in Spring in Beijing Based on Multi-Axis Differential Optical Absorption Spectroscopy Detection[J]. Spectroscopy and Spectral Analysis, 2022, 42(1): 265
- Spectroscopy and Spectral Analysis
- Vol. 42, Issue 1, 265 (2022)
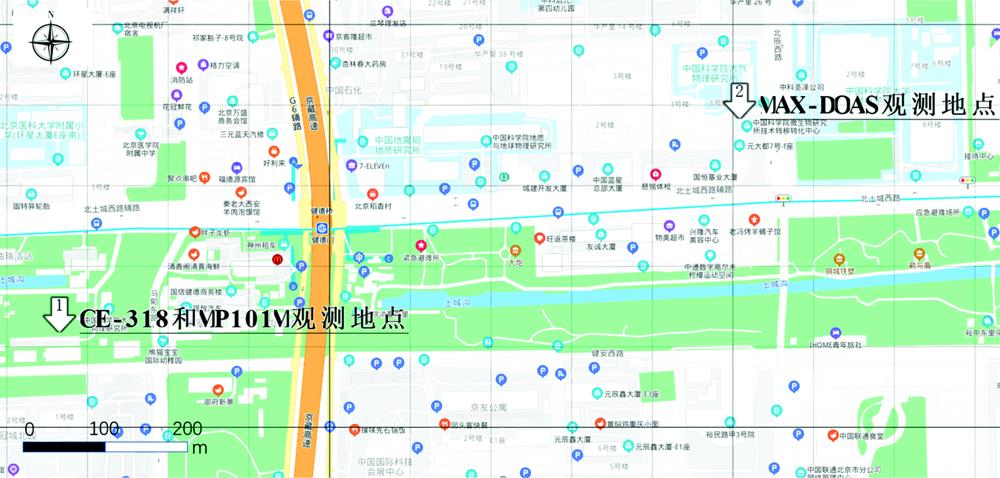
Fig. 1. Location map of observation points
(1): CE-318, MP101m observation site; (2): MAX-DOAS observation site
(1): CE-318, MP101m observation site; (2): MAX-DOAS observation site
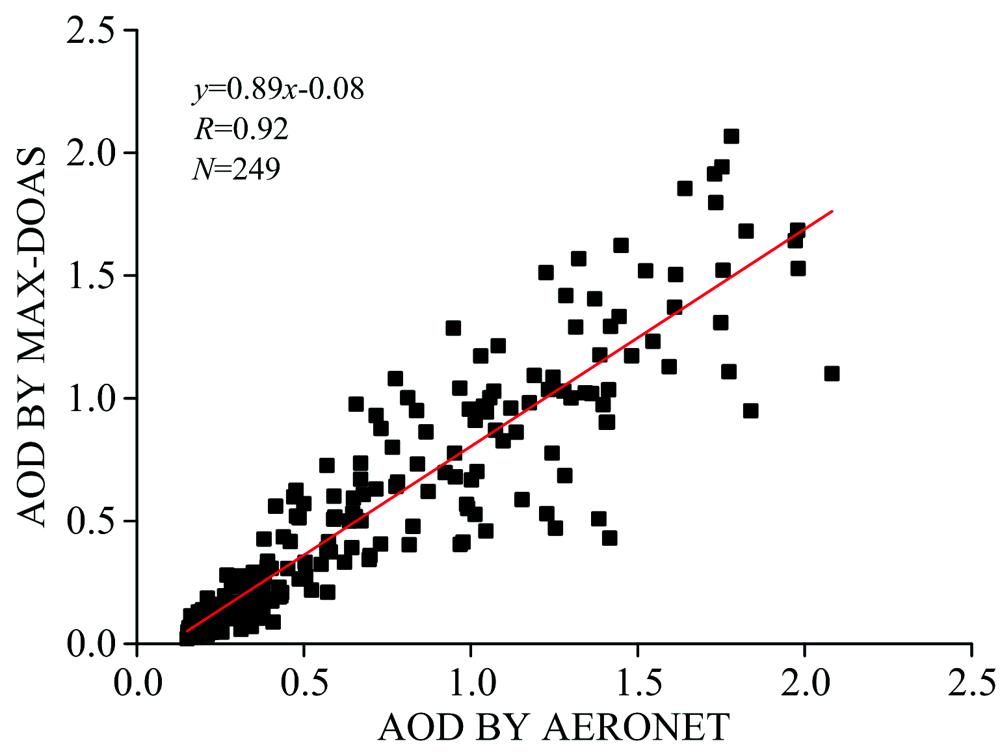
Fig. 2. AOD correlation analysis between CE-318 and MAX-DOAS
Fig. 3. Correlation between mass concentration of three-layer PM2.5 and extinction coefficient of aerosol
(a): 60 m; (b): 160 m; (c): 280 m
(a): 60 m; (b): 160 m; (c): 280 m
Fig. 4. The analysis diagram of Beijing area on May 11, 2019
(a): Aerosol extinction coefficient and Angstrom exponent;(b): Gradient Richardson number in Beijing area, at 8 a.m.
(a): Aerosol extinction coefficient and Angstrom exponent;(b): Gradient Richardson number in Beijing area, at 8 a.m.
Fig. 5. The analysis diagram of Beijing area on May 11, 2019
(a): Aerosol extinction coefficient and boundary layer height; (b): Gradient Richardson number in Beijing area, at 8 a.m.
(a): Aerosol extinction coefficient and boundary layer height; (b): Gradient Richardson number in Beijing area, at 8 a.m.
Fig. 6. The analysis diagram of Beijing on Apr 23, 2019
(a): Aerosol extinction coefficient and boundary layer height; (b): Gradient Richardson number in Beijing area, at 8 a.m.
(a): Aerosol extinction coefficient and boundary layer height; (b): Gradient Richardson number in Beijing area, at 8 a.m.
Fig. 7. Mean vertical profile of Aerosol extinction coefficient and PM2.5
|
Table 1. Threshold results applied to Max-DOAS

Set citation alerts for the article
Please enter your email address
© Copyright 2018-2021 | Chinese Laser Press. All Rights Reserved 沪ICP备15018463号-20