
Xiaoyang Chen, Ming Gao. Design of airborne dual-band common aperture photoelectric aiming optical system[J]. Infrared and Laser Engineering, 2021, 50(5): 20200322
- Infrared and Laser Engineering
- Vol. 50, Issue 5, 20200322 (2021)
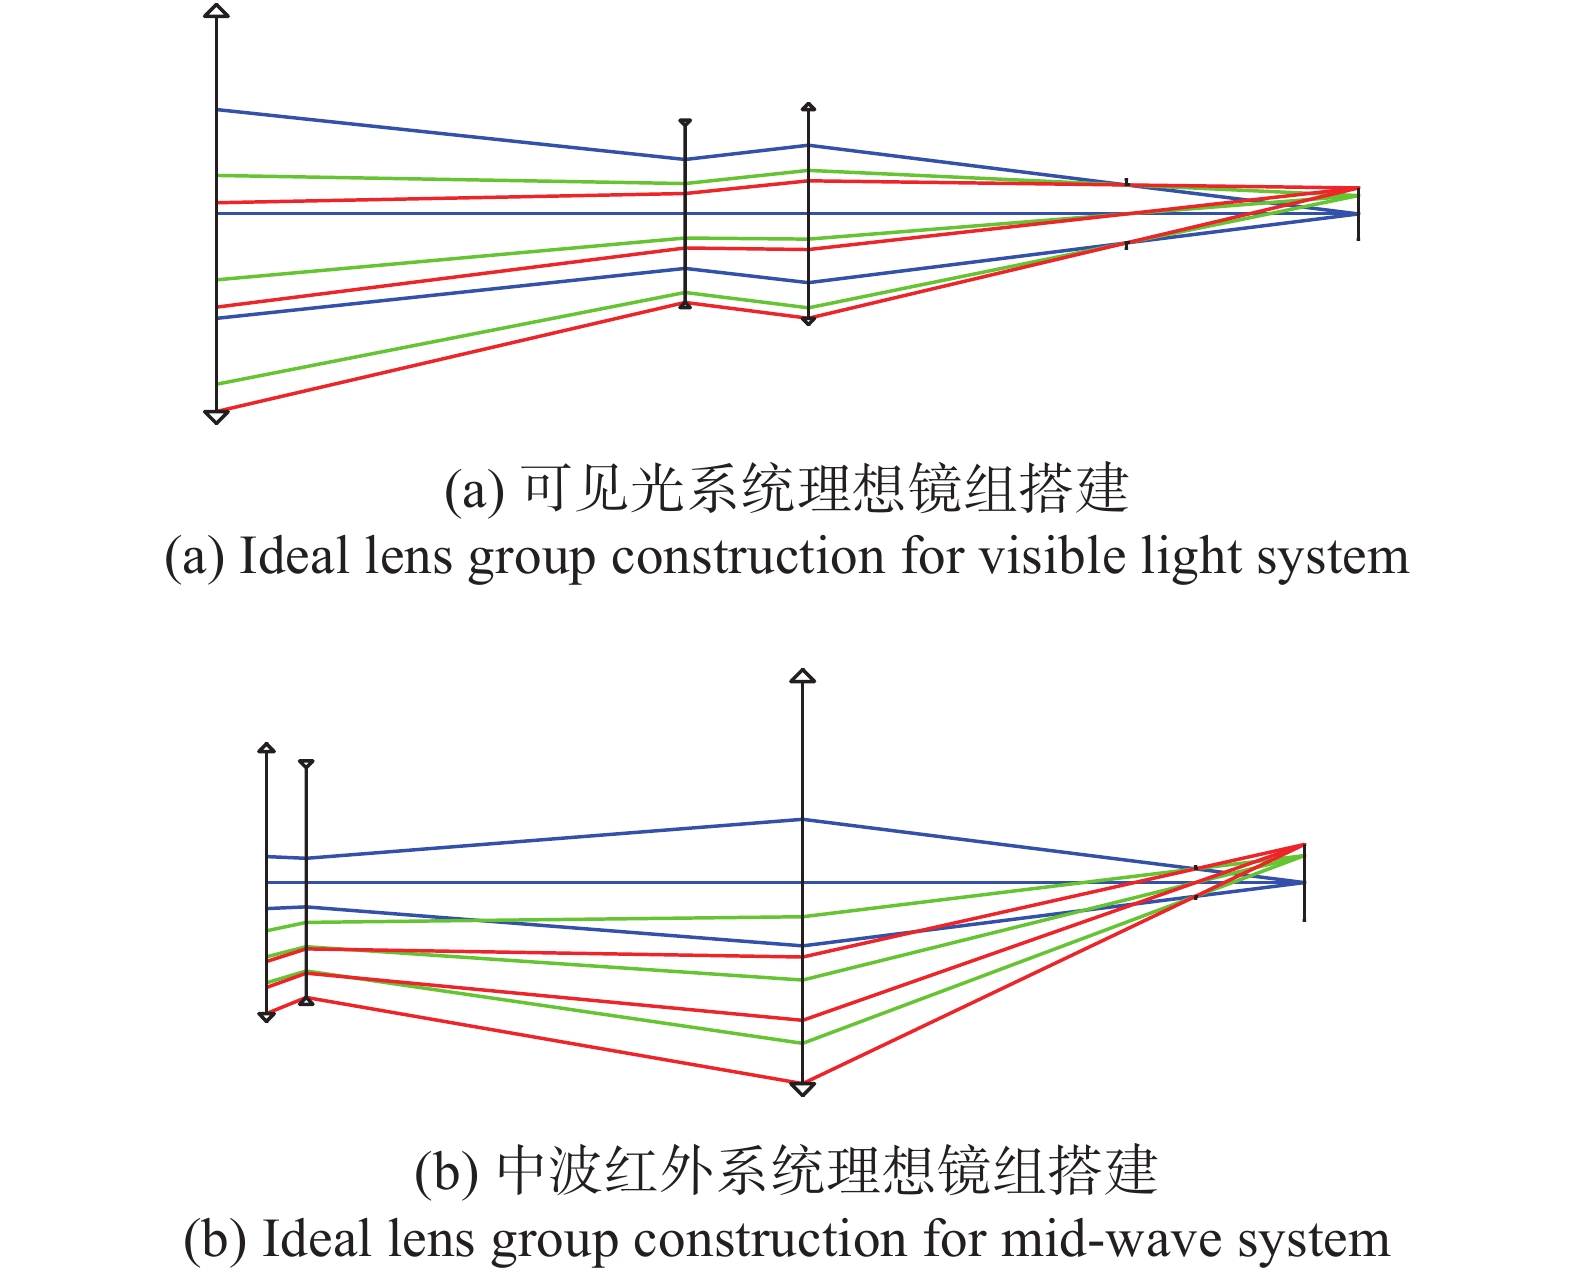
Fig. 1. Ideal lens group construction
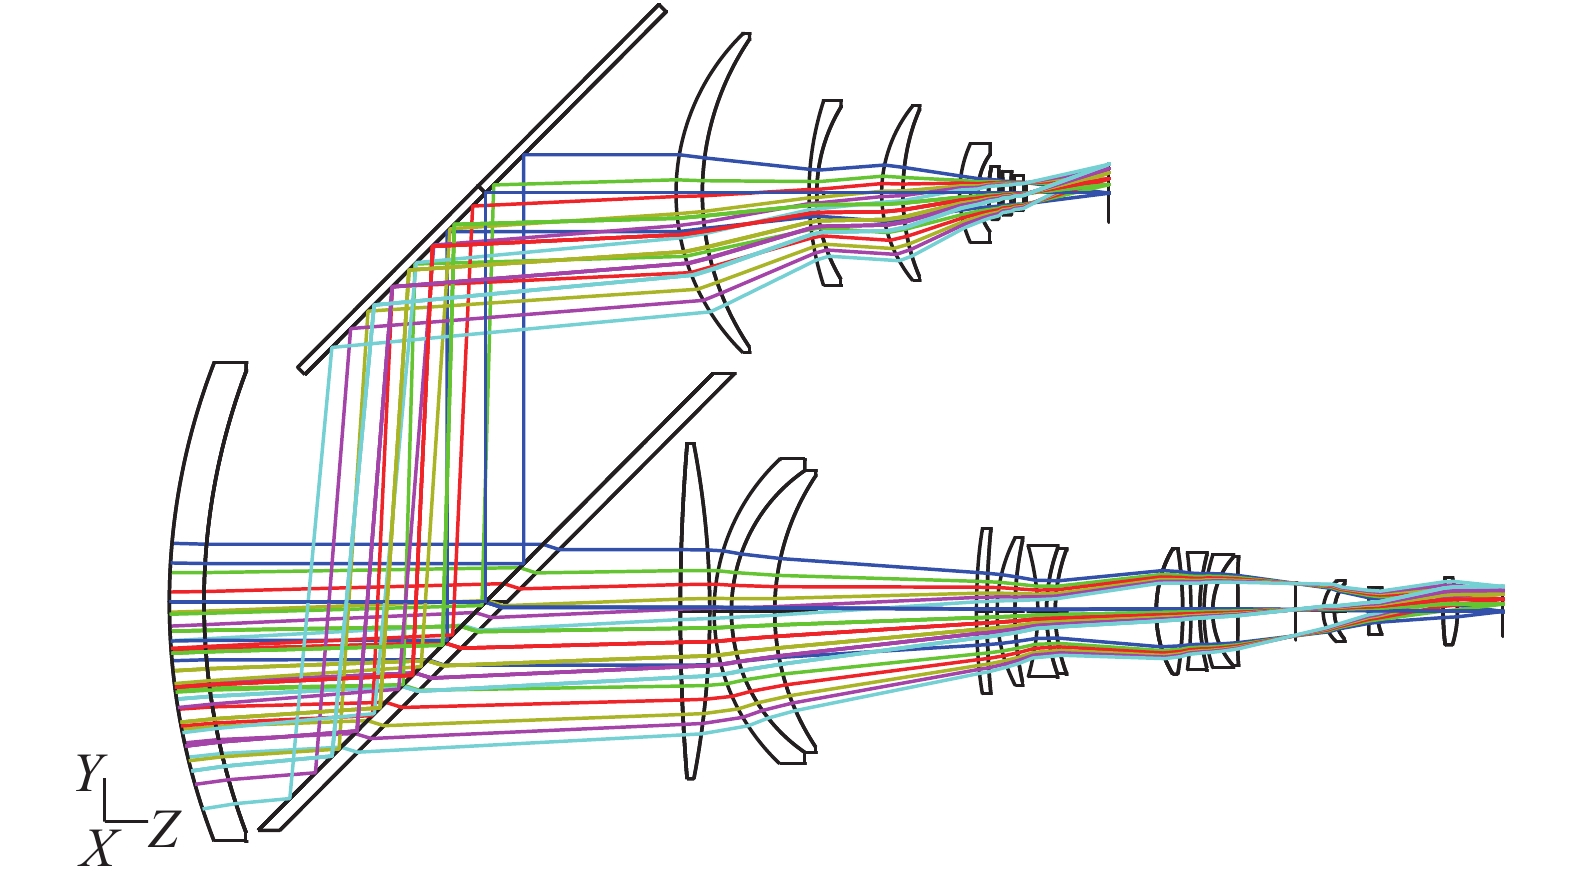
Fig. 2. Optical system structure diagram
Fig. 3. Spot diagram of visible light imaging system
Fig. 4. Modulation transfer function diagram of visible light imaging system
Fig. 5. Zoom curve of visible light imaging system
Fig. 6. Spot diagram of mid-wave infrared imaging system
Fig. 7. Modulation transfer function diagram of mid-wave infrared imaging system
Fig. 8. Modulation transfer function diagram of visible light imaging system at −40 ℃ and 60 ℃
Fig. 9. Modulation transfer function diagram of mid-wave infrared imaging system at −40 ℃ and 60 ℃
Fig. 9. [in Chinese]
Fig. 10. Relationship between spatial frequency and MRTD
Fig. 11. Relationship between spatial frequency, transmission distance and MRTD
|
Table 1. Optical system parameters
|
Table 2. Visible light system focal length changes with temperature
|
Table 3. Mid-wave infrared system focal length changes with temperature
| ||||||||||||||||||||||||||||||
Table 4. Tolerance analysis MTF value
|
Table 5. Detection distance and MRTD value

Set citation alerts for the article
Please enter your email address
© Copyright 2018-2021 | Chinese Laser Press. All Rights Reserved 沪ICP备15018463号-20