• Laser & Optoelectronics Progress
  • Vol. 55, Issue 6, 061101 (2018)
Tiejun Li1、2、1; 2; , Yue Sun1、1; , Guifang Shao、3*; *; , Weiren Shi1、1; , Jianjun Liu4、4; , and Shihan Yan5、5;
Author Affiliations
  • 1 College of Automation, Chongqing University, Chongqing 400044, China
  • 2 College of Information Engineering, Jimei University, Xiamen, Fujian 361021, China
  • 4 School of Electronic Engineering, Jiujiang University, Jiujiang, Jiangxi 130061, China
  • 5 Research Center of THz Technology, Chongqing Institute of Green and Intelligent Technology,Chinese Academy of Sciences, Chongqing 400714, China
  • show less
    DOI: 10.3788/LOP55.061101 Cite this Article Set citation alerts
    Tiejun Li, Yue Sun, Guifang Shao, Weiren Shi, Jianjun Liu, Shihan Yan. Terahertz Nondestructive Detection Method of Ceramic Matrix Composites[J]. Laser & Optoelectronics Progress, 2018, 55(6): 061101 Copy Citation Text show less
    API T-Ray 5000 THz transmission time domain spectral detection system. (a) Schematic; (b) physical map
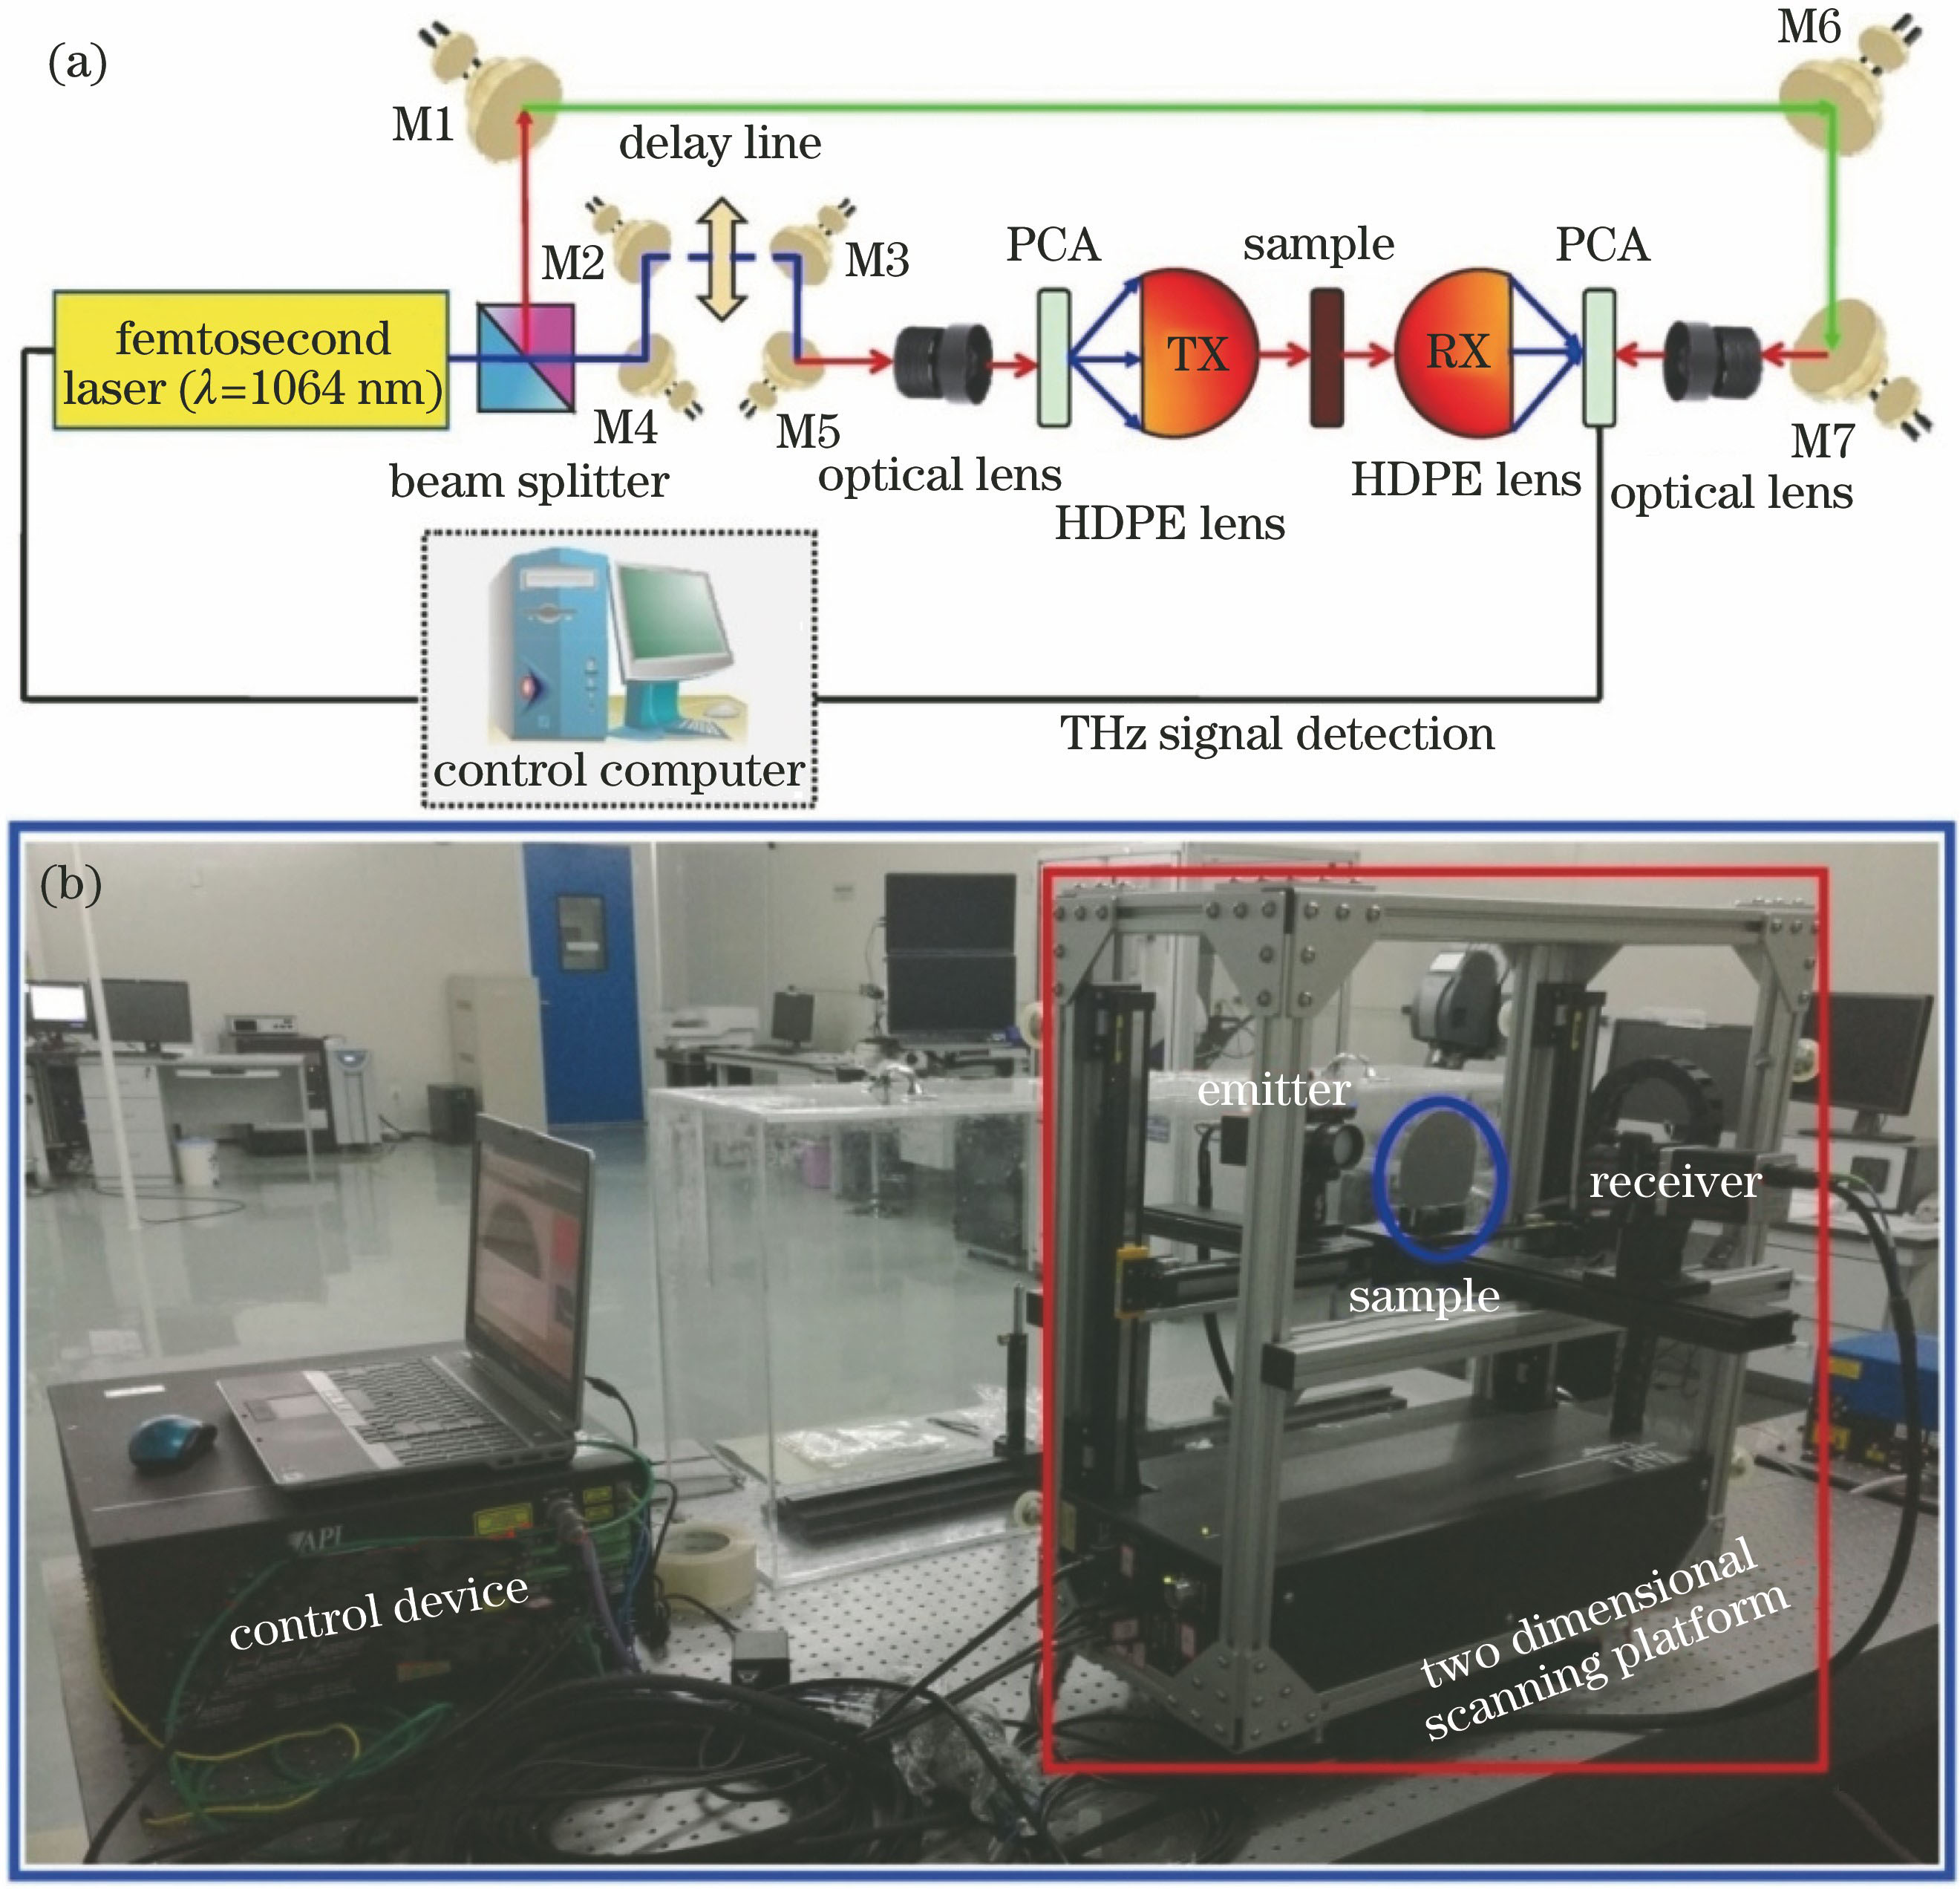
    Fig. 1. API T-Ray 5000 THz transmission time domain spectral detection system. (a) Schematic; (b) physical map
    Flow chart of THz nondestructive detection method based on multi-modes imaging and SIFT feature clustering
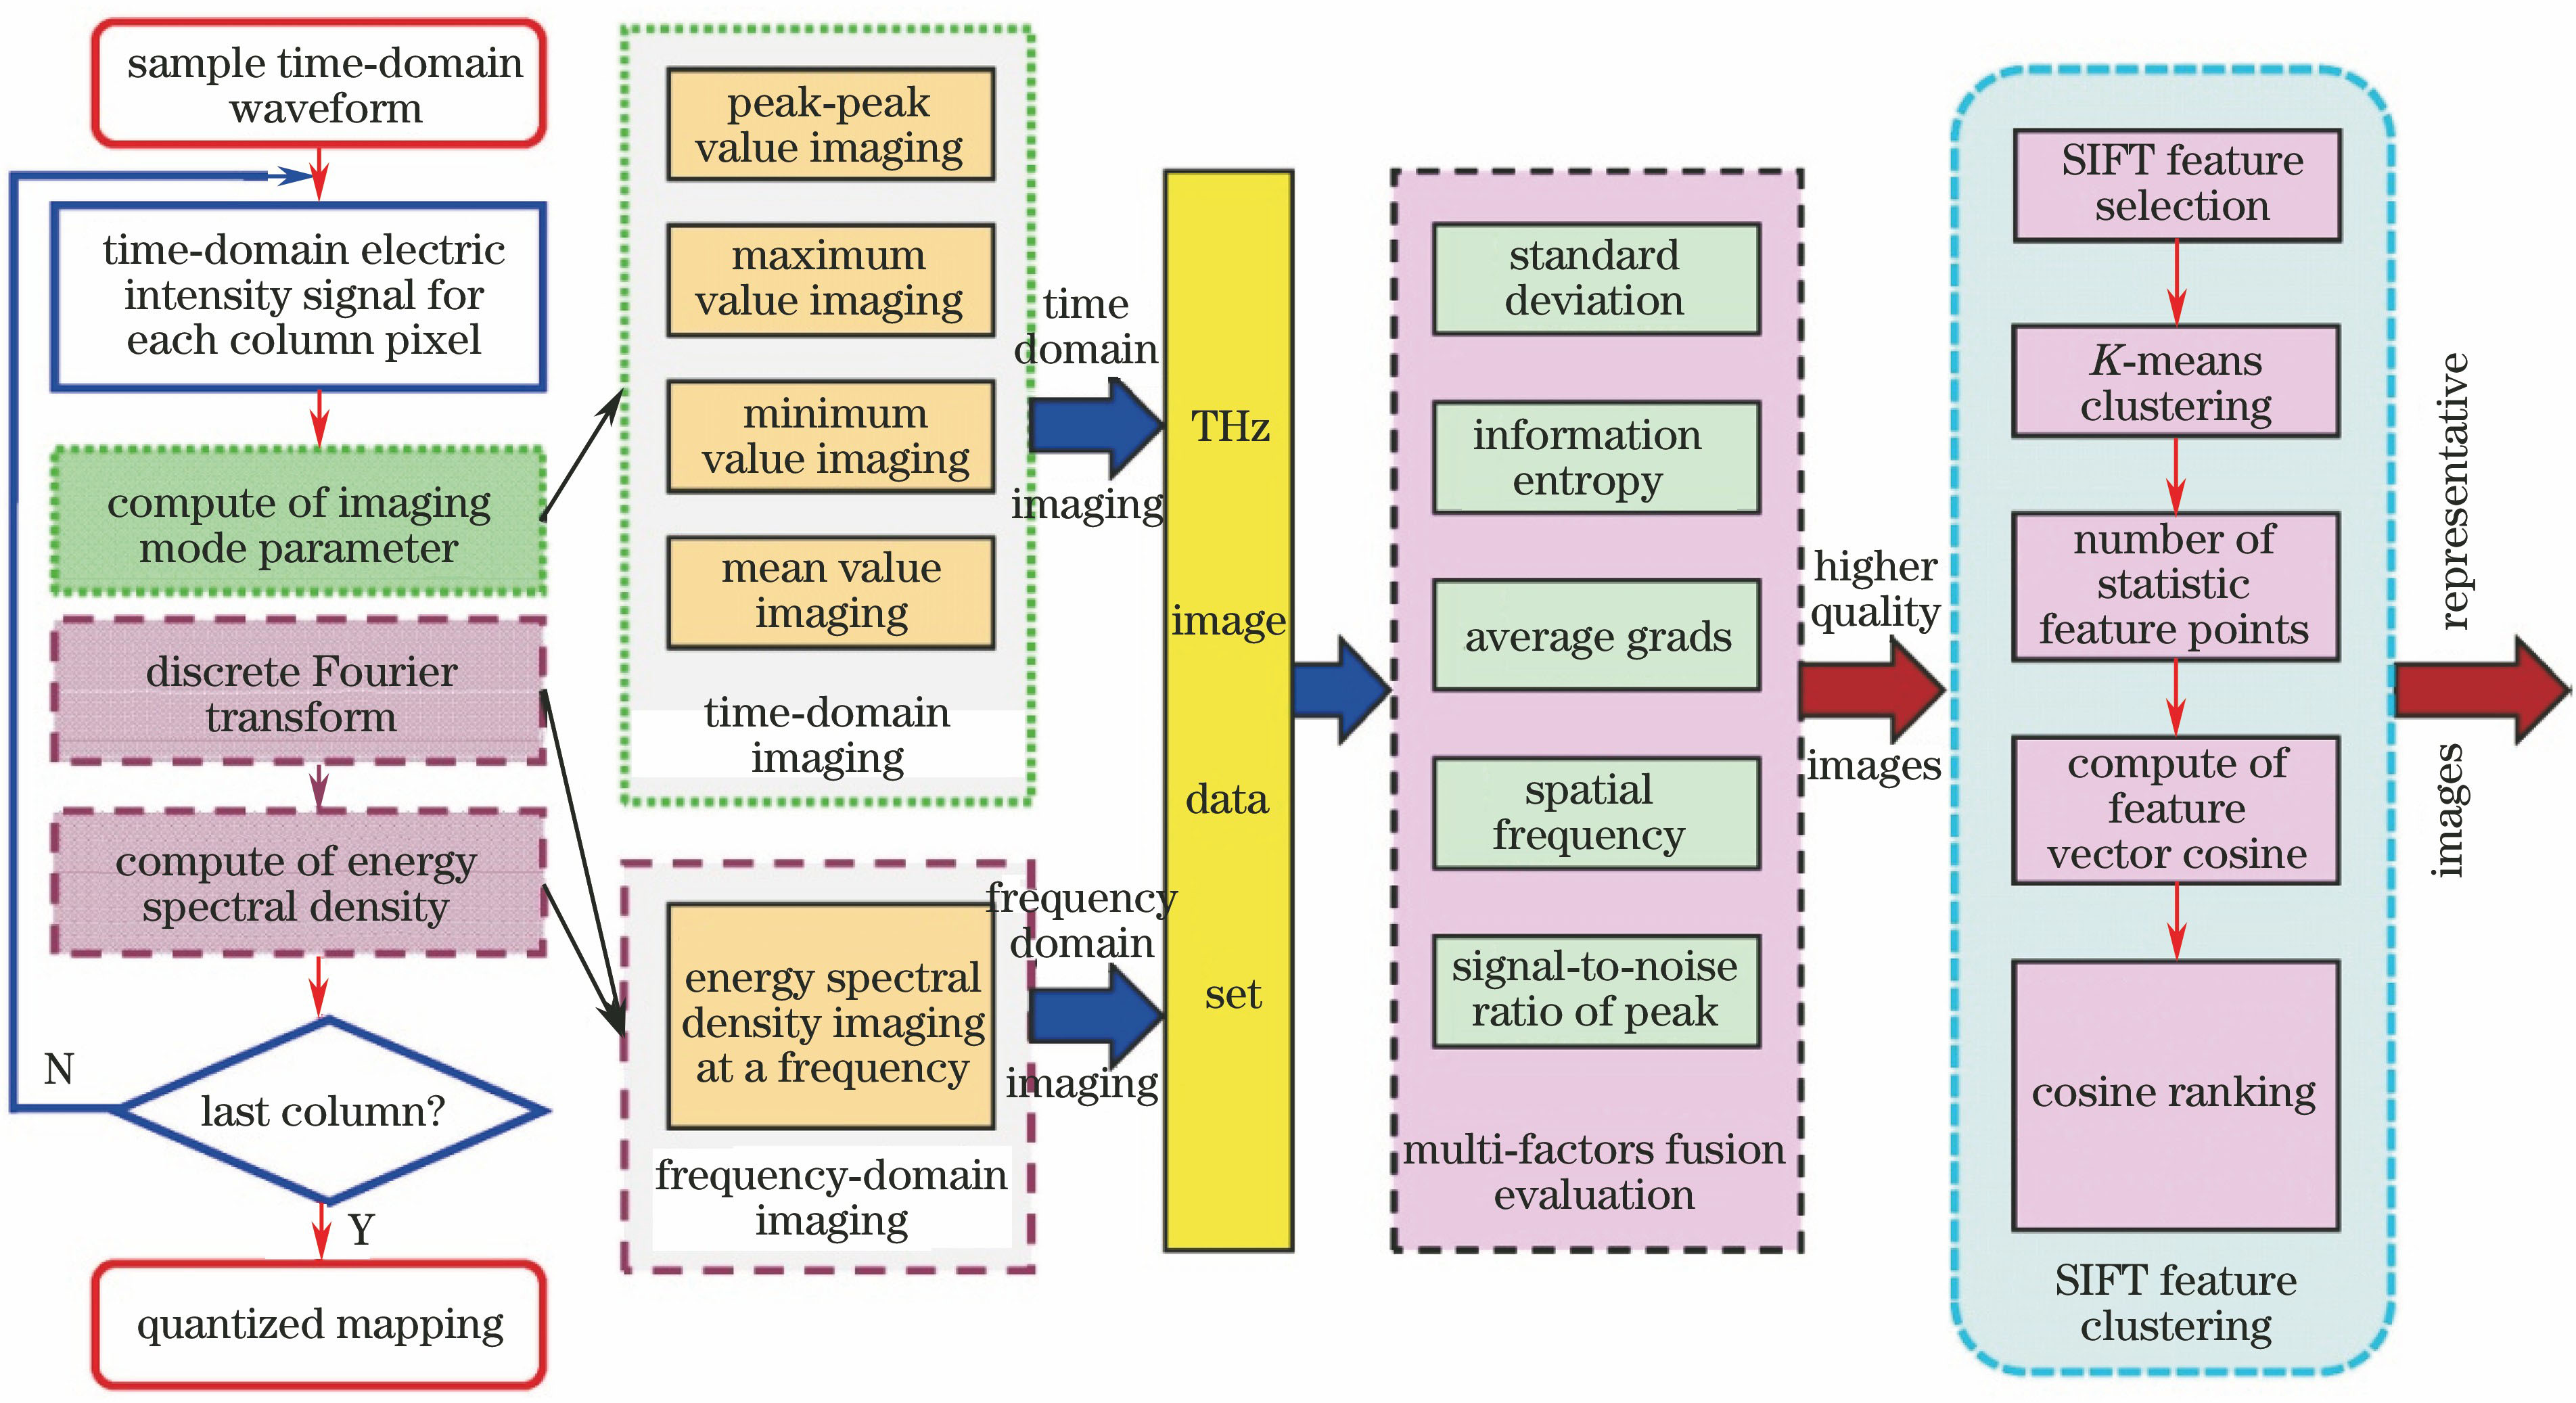
    Fig. 2. Flow chart of THz nondestructive detection method based on multi-modes imaging and SIFT feature clustering
    Transmission spectra of samples. (a) Time domain; (b) frequency domain
    Fig. 3. Transmission spectra of samples. (a) Time domain; (b) frequency domain
    Comparison among THz imaging results of Al2O3 sample under various imaging modes. (a) Optical images; (b) imaging from API system; (c) peak-peak value imaging; (d) average value imaging; (e) 0.20 THz imaging; (f) 0.34 THz imaging; (g) 0.76 THz imaging; (h) 1.30 THz imaging
    Fig. 4. Comparison among THz imaging results of Al2O3 sample under various imaging modes. (a) Optical images; (b) imaging from API system; (c) peak-peak value imaging; (d) average value imaging; (e) 0.20 THz imaging; (f) 0.34 THz imaging; (g) 0.76 THz imaging; (h) 1.30 THz imaging
    Comparison among THz imaging results of AlN sample under various imaging modes. (a) Optical images; (b) imaging from API system; (c) peak-peak value imaging; (d) average value imaging; (e) 0.36 THz imaging; (f) 0.83 THz imaging; (g) 1.48 THz imaging; (h) 1.80 THz imaging
    Fig. 5. Comparison among THz imaging results of AlN sample under various imaging modes. (a) Optical images; (b) imaging from API system; (c) peak-peak value imaging; (d) average value imaging; (e) 0.36 THz imaging; (f) 0.83 THz imaging; (g) 1.48 THz imaging; (h) 1.80 THz imaging
    Comparison among THz imaging results of BeO sample under various imaging modes. (a) Optical images; (b) imaging from API system; (c) peak-peak value imaging; (d) average value imaging; (e) 0.36 THz imaging; (f) 0.67 THz imaging; (g) 1.48 THz imaging; (h) 1.82 THz imaging
    Fig. 6. Comparison among THz imaging results of BeO sample under various imaging modes. (a) Optical images; (b) imaging from API system; (c) peak-peak value imaging; (d) average value imaging; (e) 0.36 THz imaging; (f) 0.67 THz imaging; (g) 1.48 THz imaging; (h) 1.82 THz imaging
    Comparison among THz imaging results of ZrO2 sample under various imaging modes. (a)Optical images; (b) imaging from API system; (c) peak-peak value imaging; (d) average value imaging; (e) 0.24 THz imaging; (f) 0.29 THz imaging; (g) 0.37 THz imaging; (h) 0.46 THz imaging
    Fig. 7. Comparison among THz imaging results of ZrO2 sample under various imaging modes. (a)Optical images; (b) imaging from API system; (c) peak-peak value imaging; (d) average value imaging; (e) 0.24 THz imaging; (f) 0.29 THz imaging; (g) 0.37 THz imaging; (h) 0.46 THz imaging
    Representative THz images of Al3O2 sample at different frequencies. (a) 0.86562 THz; (b) 0.88125 THz; (c) 0.91562 THz; (d) 0.85 THz; (e) 0.85312 THz; (f) 0.91875 THz; (g) 0.88437 THz; (h) 0.96875 THz
    Fig. 8. Representative THz images of Al3O2 sample at different frequencies. (a) 0.86562 THz; (b) 0.88125 THz; (c) 0.91562 THz; (d) 0.85 THz; (e) 0.85312 THz; (f) 0.91875 THz; (g) 0.88437 THz; (h) 0.96875 THz
    Representative THz images of AlN sample at different frequencies. (a) 1.4844 THz; (b) 1.4969 THz; (c) 1.5 THz; (d) 1.5937 THz; (e) 1.4781 THz; (f) 1.5906 THz; (g) 1.3375 THz; (h) 1.1687 THz
    Fig. 9. Representative THz images of AlN sample at different frequencies. (a) 1.4844 THz; (b) 1.4969 THz; (c) 1.5 THz; (d) 1.5937 THz; (e) 1.4781 THz; (f) 1.5906 THz; (g) 1.3375 THz; (h) 1.1687 THz
    Representative THz images of BeO sample at different frequencies. (a) 1.4781 THz; (b) 1.4719 THz; (c) 1.1969 THz; (d) 1.1937 THz; (e) 1.475 THz; (f) 1.1875 THz; (g) 1.4656 THz; (h) 1.4687 THz
    Fig. 10. Representative THz images of BeO sample at different frequencies. (a) 1.4781 THz; (b) 1.4719 THz; (c) 1.1969 THz; (d) 1.1937 THz; (e) 1.475 THz; (f) 1.1875 THz; (g) 1.4656 THz; (h) 1.4687 THz
    Representative THz images of ZrO2 sample at different frequencies. (a) 0.31562 THz; (b) 0.38437 THz; (c) 0.2625 THz; (d) 0.32187 THz; (e) 0.35625 THz; (f) 0.3875 THz; (g) 0.39062 THz; (h) 0.325 THz
    Fig. 11. Representative THz images of ZrO2 sample at different frequencies. (a) 0.31562 THz; (b) 0.38437 THz; (c) 0.2625 THz; (d) 0.32187 THz; (e) 0.35625 THz; (f) 0.3875 THz; (g) 0.39062 THz; (h) 0.325 THz
    Similarity cosine value distributions of images for four kinds of samples
    Fig. 12. Similarity cosine value distributions of images for four kinds of samples
    SampleSDHAGSFPSNR /dB
    Al2O3(0.76 THz imaging)27.30296.31363.19636.783517.7804
    AlN(1.48 THz imaging)30.54936.29039.680517.089110.8352
    BeO(1.48 THz imaging)27.46786.49808.397314.58159.8233
    ZrO2(0.24 THz imaging)57.27626.51411.34612.73347.5815
    Table 1. Comparison among objective evaluation indexes for image quality
    Tiejun Li, Yue Sun, Guifang Shao, Weiren Shi, Jianjun Liu, Shihan Yan. Terahertz Nondestructive Detection Method of Ceramic Matrix Composites[J]. Laser & Optoelectronics Progress, 2018, 55(6): 061101
    Download Citation