Abstract
An automated superpixels identification/mosaicking method is presented for the analysis of cone photoreceptor cells with the use of adaptive optics scanning laser ophthalmoscope (AO-SLO) images. This is an image oversegmentation method used for the identification and mosaicking of cone photoreceptor cells in AO-SLO images. It includes image denoising, estimation of the cone photoreceptor cell number, superpixels segmentation, merging of superpixels, and final identification and mosaicking processing steps. The effectiveness of the presented method was confirmed based on its comparison with a manual method in terms of precision, recall, and F1-score of 77.3%, 95.2%, and 85.3%, respectively.Adaptive optics (AO) was invented and used in astronomical telescopes to correct optical aberrations induced by atmospheric distortion[1]. Although the AO technology was originally utilized in astronomical telescopes, it has many applications[2,3]. As one of the most successful examples, it has already been extensively applied in retinal imaging to correct ocular aberrations[4–10]. Taking advantage of AO technology, AO scanning laser ophthalmoscopy (AO-SLO) can perform in vivo retinal imaging at the cellular level[6,11–13]. Thus, the AO-SLO images can be used for the identification of cone photoreceptor cells and mosaicking that is important for the understanding of the cellular nature of retinal diseases, diagnosis and prognosis of these diseases, and for the study of the treatment efficacy and ophthalmic examinations. Although manual methods are the most accurate and reliable ways for the identification of photoreceptor cells and mosaicking, they are time-consuming. Therefore, many research studies have aimed at the development of semi-automated and automatic ways for the identification of photoreceptor cells and mosaicking[14–23]. These methods consist of nonlearning-[14–19], supervised-learning-[20–22], and unsupervised-learning-based methods[23]. Although supervised-learning-based methods[20–22] achieve photoreceptor cell identification and mosaicking performances with high accuracies, they still require a lot of labeled data provided by manual methods for supervision purposes. Moreover, this also consumes human labor and time.
Ren and Malik introduced in 2003 a segmentation method without supervision, whereby the superpixels algorithm groups pixels according to their brightness levels and their relationships with their neighbors[24]. One of its implementation variants without supervision is known as simple linear iterative clustering (SLIC)[25] and is extensively used in the area of biomedical image processing[26–28].
In this study, we introduce for the first time, to the best of our knowledge, a superpixels method for the identification of cone photoreceptor cells and mosaicking for AO-SLO images. Specifically, the SLIC method, which is a superpixels method without supervision, is adopted as an image oversegmentation method at the initial stage of the identification of cone photoreceptor cells and mosaicking. Based on superpixels segmentation and superpixels merging, the final identification and mosaic patterns were generated, and the effectiveness of our method was confirmed. To verify our method, we compared our results with those obtained with a manual identification approach.
Sign up for Chinese Optics Letters TOC. Get the latest issue of Chinese Optics Letters delivered right to you!Sign up now
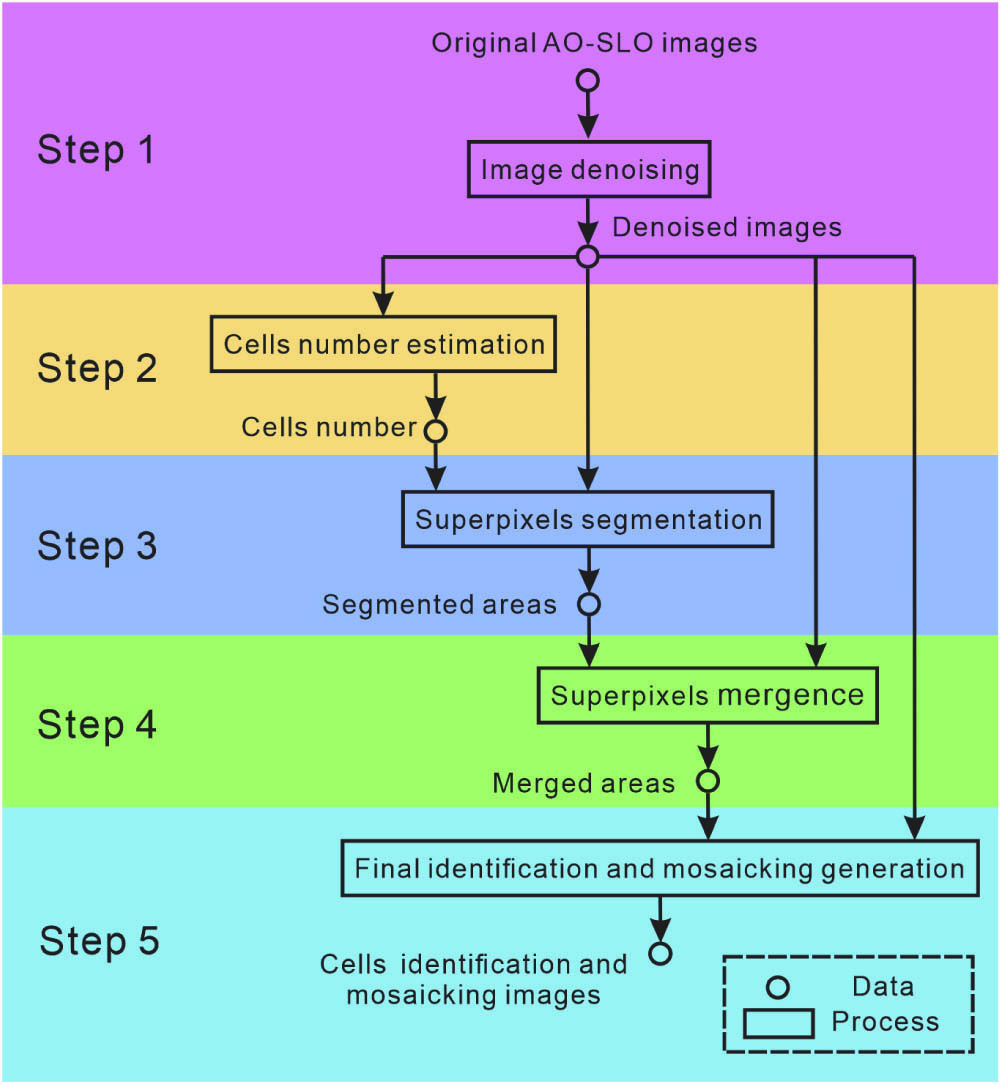
We describe our automated image processing procedure for photoreceptor cell identification and mosaicking as follows. The flow diagram of the algorithm used is shown in Fig. 1. The processing included five steps: (1) image denoising, (2) cone photoreceptor cell number estimation, (3) superpixels segmentation, (4) superpixels merging, and (5) final identification and mosaicking pattern generation. In the first step, the AO-SLO image was denoised by averaging multiple registered images[29]. In the second step, the total number of cone photoreceptor cells in the image was estimated with the use of the modal image spacing (Yellott’s ring)[17,30]. In the third step, the image was segmented by the SLIC superpixels algorithm[25]. In the fourth step, the superpixels whose relative centroid distances were less than the diameter of the cone photoreceptor cell were merged in a single superpixel. In the final step, cone photoreceptor cells were identified, and their mosaic image was generated.

Figure 1.Diagram depicting the image processing of the proposed algorithmic steps.
Although the AO-SLO has high imaging resolution owing to the correction of optical aberration, its signal-to-noise ratio (SNR) is low. To improve the image quality, the enhancement of SNR is highly desired. To reliably denoise the AO-SLO images, we first registered the AO-SLO images and then averaged them with the optical-flow-based method proposed in Ref. [29]. In this method, the AO-SLO images were accurately registered by the optical flow registration method that possesses a large number of registration degrees-of-freedom[29]. An example of image denoising using a representative image patch is shown in Fig. 2. As shown in the figure, the noise was significantly suppressed after the denoising. This confirmed the effectiveness of the denoising method in Ref. [29].
Figure 2.Example of image denoising: (a) before denoising and (b) after denoising.
To utilize the superpixels segmentation of SLIC[25], we needed to determine the approximate number of required superpixels that constitute a mandatory input of SLIC segmentation. This number was calculated based on the estimated number of cone photoreceptor cells in the image. Accordingly, we estimated the total number of cone photoreceptor cells in the image based on the image modal spacing (Yellott’s ring)[17,30]. Firstly, the denoised image was transformed in the frequency domain with the use of the discrete Fourier transform (DFT), and a log10 transformation was applied to the power values of the Fourier transformed image[30], as shown in Fig. 3(a). This resulted in a frequency-domain image with a circular band that corresponded to the spatial frequency of the cone cells in the original image[30], as shown in Fig. 3(b). Secondly, eighteen slices radiating from the center were selected at 20° intervals around the clock and then averaged to obtain the blue curve in Fig. 3(c). Thirdly, the underlying distribution was estimated with the least-squares fit of the data with the sum of two exponentials[30], as shown by the curve highlighted in red in Fig. 3(c). The subtraction of the fitted curve from the actual data [blue curve in Fig. 3(c)][30] is shown in Fig. 3(d). Finally, the highest peak location, as shown by the line highlighted in magenta in Fig. 3(d) and corresponding to the dashed line highlighted in magenta in Fig. 3(b), was regarded as the region that corresponded to the spatial frequency of the cone photoreceptor cells. Accordingly, the spatial frequency and estimated number of cone photoreceptor cells were calculated according to this spatial frequency. By this means, the estimated cone photoreceptor cells density of image shown in Fig. 3 is around 27,171 cones/mm2, which is in the range of cone densities seen in healthy eyes by the classic histological analyses[31].
Figure 3.Cone photoreceptor cell number estimation: (a) denoised image, (b) power of discrete Fourier transform (DFT) of a log10 compressed, (c) averaged slice of (b), fitted curve in red, and (d) subtraction outcome of fitted curve (highlighted in red) from the blue curve in (c).
To achieve a fine segmentation of cone photoreceptor cells, we magnified the denoised image four times isotropically with bicubic interpolation before SLIC superpixels segmentation. For the preparation of the SLIC superpixels segmentation, we calculated the approximate superpixels number that was expected to be required based on the estimated number of cone photoreceptor cells in the image. Because the image included some of the interstitial space, we set empirically the approximate number of superpixels that was expected to be created to 1.2 times the estimated number of cone photoreceptor cells in the image. By inputting the magnified and denoised image and the approximate superpixels number expected to be created, we performed SLIC segmentation[25] on magnified denoised images. An example of SLIC superpixels segmentation with a representative image patch is shown in Fig. 4. As shown in the figure, the photoreceptor cells in the denoised image are oversegmented.
Figure 4.Simple linear iterative clustering (SLIC) superpixels segmentation: (a) original image patch and (b) segmented image with oversegmentation.
To partially solve the oversegmentation problem mentioned earlier, the superpixels, whose relative centroid distances are less than the diameter of the cone photoreceptor cells, were merged in a single superpixel. The first step involved the generation of the centroids of all the superpixels based on the averaging of the location coordinates inside the superpixels. In the second step, we merged the superpixels, whose relative centroid distances were less than the diameters of the cone photoreceptor cells (12 pixels length in our magnified and denoised images) in a single superpixel, as shown in Fig. 5. The first step and second step were performed in an iterative manner until no more superpixels were merged. An example of the superpixels merging process with a representative image patch is shown in Fig. 6. As shown, the oversegmentation problem in Fig. 4 was partially solved.
Figure 5.Superpixels merging process.
Figure 6.Example of superpixels merging outcome: (a) before merging and (b) after merging.
In the cell identification process, we need to distinguish superpixels that contain photoreceptor cells from those that contained interstitial space. First, gamma correction () was applied to the magnified and denoised image. Secondly, superpixels whose mean intensity values were higher than the threshold were regarded as superpixels that contained photoreceptor cells: where “–––––” is arithmetic mean value operator, and σ is the standard deviation. By using the superpixels segmentation and photoreceptor cell identification outcomes, a mosaic image was created based on the estimation of the average value of the intensity in each photoreceptor cell area, and the color of the superpixels containing interstitial space is set to black.
An AO-SLO with a 30 Hz imaging rate was used for imaging the posterior parts of the eyes. The field-of-view (FOV) on the human retina was 1.5°, and the frame size was approximately . Thus, a transverse area of approximately was scanned based on the assumption of a focal length of 17 mm for the human eye. The details of the system are described in Ref. [32]. Drops of tropicamide (1%) and phenylephrine hydrochloride (2.5%) were administered to dilate the pupil to a diameter in the range of . Light exposure adhered to the maximum permissible exposure limits set by the American National Standards Institute[33] at all times.
The typical computational time of fully automated processing of image is 49.71 s for image denoising, 0.78 s for photoreceptor cells number estimation, 1.06 s for superpixels segmentation, 0.31 s for superpixels mergence, and 1.83 s for identification and mosaicking. The computational time was examined with an Intel Core i5-9400 CPU operating at 2.90 GHz, NVIDIA GeForce GTX 1660 Ti graphic card, and 16.0 GB RAM, and the processing program was written in MATLAB (64-bit) and CUDA 10.0.
To evaluate the effectiveness of our method, five eyes from five healthy subjects were measured near the centers of their foveae. Our method successfully identified and segmented these five datasets, and the overall precision, recall, and F1-score are listed in Table 1. Listed outcomes regarded the manual identification as the ground truth. As shown in Table 1, recall is much higher than precision. This is due to the oversegmentation property of superpixels segmentation.
| Precision | Percentage of actual cells in identified cells | 77.3% |
| Recall | Percentage of actual cells identified | 95.2% |
| F1-score | 2×Precision×Recall/(Precision + Recall) | 85.3% |
Table 1. Evaluation of the Effectiveness of Cell Identification: Overall Precision, Recall, and F1-Score Outcomes
To test the performance of our method in different styles of images, four examples containing input AO-SLO images [Fig. 7(a)], images showing the identified cell and segmented image [Fig. 7(b)], and cell mosaic images [Fig. 7(c)] are presented in Fig. 7. The first, second, and third examples taken from different locations of a healthy retina, whose estimated cone photoreceptor cells densities are around 45,164, 32,846, and 25,359 cones/mm2, respectively, are shown in the top three rows in Fig. 7. The bottom row in Fig. 7 shows an example and processed results of an AO-SLO image with diabetic retinopathy[34]. As shown in Fig. 7, our algorithm provided more or less accurate results for the healthy retina, but not for the pathological retina due to the highly irregular distributions of cone photoreceptor cells.
Figure 7.Performance of the proposed method: (a) input AO-SLO image, (b) identification of cells and segmented image, and (c) mosaic image.
Owing to the oversegmentation property of superpixels segmentation, our current method is associated with a low-precision and high-recall rate. One important future improvement is the identification of a good algorithm that will further remove the superpixels associated with interstitial spaces with a minimum loss of superpixels that concurrently contain photoreceptor cells. As shown in the bottom row of Fig. 7, our current method cannot provide accurate results for the pathological eye. Thus, another important future improvement is modifying the current algorithm to achieve highly accurate processing for pathological eyes.
In this study, an automated method for identification and mosaicking of cone photoreceptor cells was proposed. The superpixels method, which is an image oversegmentation method, is used for identification and mosaicking of cone photoreceptor cells in an AO-SLO image. By showing the superpixels segmentation, superpixels mergence, and final identification and mosaicking generation, the effectiveness of our method was confirmed. To verify our method, we compared our identification results with those of manual identification, which indicated that the precision, recall, and F1-score of identification were 77.3%, 95.2%, and 85.3%, respectively.
References
[1] H. W. Babcock. Publ. Astron. Soc. Pacific, 65, 229(1953).
[2] Y. Yang, J. Zhao, H. Zhao, F. Xiao, J. Xie, T. Liu, Y. Dai. Chin. Opt. Lett., 16, 053301(2018).
[3] L. Sun, T. Liu, X. Fu, Y. Guo, X. Wang, C. Shao, Y. Zheng, C. Sun, S. Lin, L. Huang. Chin. Opt. Lett., 17, 051403(2019).
[4] A. Roorda, F. Romero-Borja, III W. J. Donnelly, H. Queener, T. J. Hebert, M. C. Campbell. Opt. Express, 10, 405(2002).
[5] S. A. Burns, R. Tumbar, A. E. Elsner, D. Ferguson, D. X. Hammer. J. Opt. Soc. Am. A, 24, 1313(2007).
[6] R. D. Ferguson, Z. Zhong, D. X. Hammer, M. Mujat, A. H. Patel, C. Deng, W. Zou, S. A. Burns. J. Opt. Soc. Am. A, 27, A265(2010).
[7] A. Dubra, Y. Sulai. Biomed. Opt. Express, 2, 1757(2011).
[8] N. D. Shemonski, F. A. South, Y.-Z. Liu, S. G. Adie, P. S. Carney, S. A. Boppart. Nat. Photon., 9, 440(2015).
[9] J. Lu, B. Gu, X. Wang, Y. Zhang. Opt. Express, 26, 14356(2018).
[10] S. Mozaffari, V. Jaedicke, F. Larocca, P. Tiruveedhula, A. Roorda. Biomed. Opt. Express, 9, 5477(2018).
[11] A. W. Dreher, J. F. Bille, R. N. Weinreb. Appl. Opt., 28, 804(1989).
[12] J. Z. Liang, D. R. Williams, D. T. Miller. J. Opt. Soc. Am. A, 14, 2884(1997).
[13] H. Hofer, L. Chen, G. Y. Yoon, B. Singer, Y. Yamauchi, D. R. Williams. Opt. Express, 8, 631(2001).
[14] K. Y. Li, A. Roorda. J. Opt. Soc. Am. A, 24, 1358(2007).
[15] A. Turpin, P. Morrow, B. Scotney, R. Anderson, C. Wolsley, 494(2011).
[16] S. J. Chiu, Y. V. Lokhnygina, A. M. Dubis, A. Dubra, J. Carroll, J. A. Izatt, S. Farsiu. Biomed. Opt. Express, 4, 924(2013).
[17] R. F. Cooper, C. S Langlo, A. Dubra, J. Carroll. Ophthalmic Physiol. Opt., 33, 540(2013).
[18] D. M. Bukowska, A. L. Chew, E. Huynh, I. Kashani, S. L. Wan, P. M. Wan, F. K. Chen. Biomed. Opt. Express, 6, 4676(2015).
[19] J. Liu, H. W. Jung, A. Dubra, J. Tam. Investig. Ophthalmol. Visual Sci., 58, 4477(2017).
[20] D. Cunefare, C. S. Langlo, E. J. Patterson, S. Blau, A. Dubra, J. Carroll, S. Farsiu. Biomed. Opt. Express, 9, 3740(2018).
[21] D. Cunefare, L. Fang, R. F. Cooper, A. Dubra, J. Carroll, S. Farsiu. Sci. Rep., 7, 6620(2017).
[22] B. Davidson, A. Kalitzeos, J. Carroll, A. Dubra, S. Ourselin, M. Michaelides, C. Bergeles. Sci. Rep., 8, 7911(2018).
[23] C. Bergeles, A. M Dubis, B. Davidson, M. Kasilian, A. Kalitzeos, J. Carroll, A. Dubra, M. Michaelides, S. Ourselin. Biomed. Opt. Express, 8, 3081(2017).
[24] X. Ren, J. Malik, 10(2013).
[25] R. Achanta, A. Shaji, K. Smith, A. Lucchi, P. Fua, S. Süsstrunk. IEEE Trans. Pattern Anal. Mach. Intell., 34, 2274(2012).
[26] A. Miyazawa, Y.-J. Hong, S. Makita, D. Kasaragod, Y. Yasuno. Biomed. Opt. Express, 8, 4396(2017).
[27] Z. Gao, W. Bu, Y. Zheng, X. Wu. Comput. Med. Imaging Graph., 55, 42(2017).
[28] J. Chu, H. Min, L. Liu, W. Lu. Med. Phys., 42, 3859(2015).
[29] Y. Chen, Y. He, J. Wang, W. Li, L. Xing, F. Gao, G. Shi. IEEE Photon. J., 12, 3700109(2020).
[30] D. Cunefare, R. F Cooper, B. Higgins, D. F. Katz, A. Dubra, J. Carroll, S. Farsiu. Biomed. Opt. Express, 7, 2036(2016).
[31] C. A. Curcio, K. R. Sloan, R. E. Kalina, A. E. Hendrickson. J. Comp. Neurol., 292, 497(1990).
[32] Y. Wang, Y. He, L. Wei, X. Li, J. Yang, H. Zhou, Y. Zhang. Chin. Opt. Lett., 15, 121102(2017).
[33] . American National Standard for Safe Use of Lasers(2007).
[34] S. A. Burns, A. E. Elsner, K. A. Sapoznik, R. L Warner, T. J. Gast. Prog. Retinal Eye Res., 68, 1(2019).