
Dong-Xi Li, Ni Zhang. Dynamical analysis for hybrid virus infection system in switching environment[J]. Chinese Physics B, 2020, 29(9):
- Chinese Physics B
- Vol. 29, Issue 9, (2020)
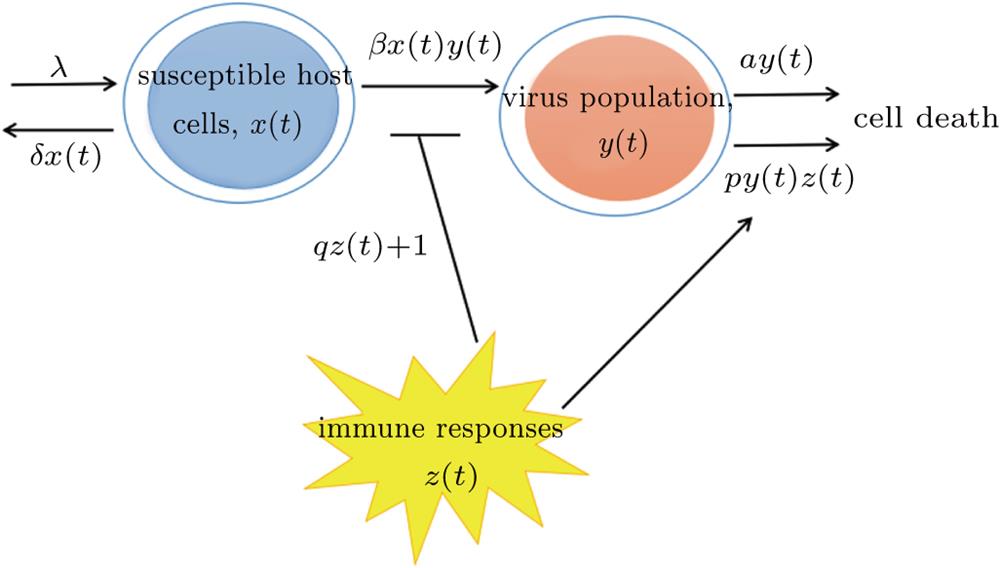
Fig. 1. Schematic diagram of our virus infection model.
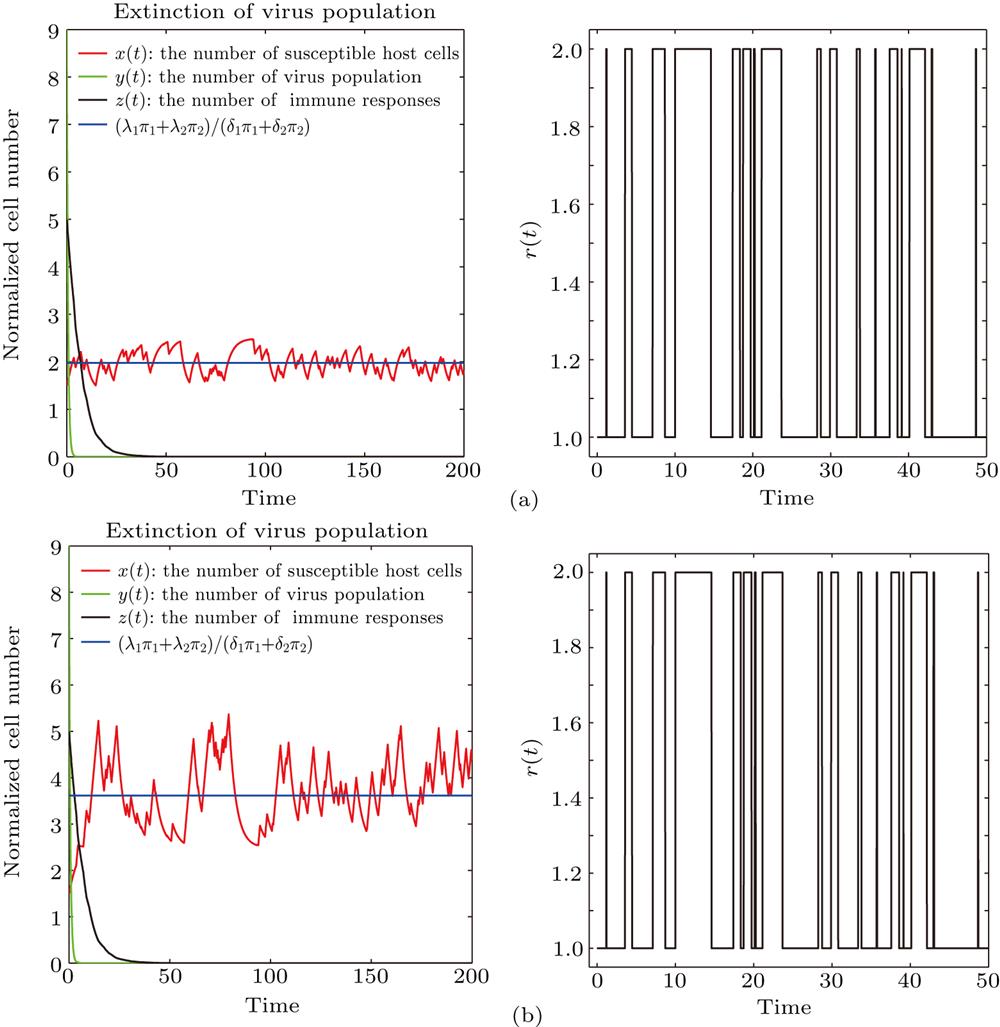
Fig. 2. Sample path x (t ), y (t ), z (t ) and its corresponding Markov chain r (t ) for the stochastic virus infection model (3 ), using the parameters c 1 = 0.0100 and c 2 = 0.0150: (a) λ 1 = 0.7130, λ 2 = 0.5181, β 1 = 0.0123, β 2 = 0.0115, δ 1 = 0.2861, δ 2 = 0.3743, a 1 = 1.523, and a 2 = 1.636, (b) λ 1 = 0.7130, λ 2 = 0.5181, β 1 = 0.0123, β 2 = 0.0115, δ 1 = 0.2861, δ 2 = 0.0101, a 1 = 1.523, a 2 = 0.401, with the initial value (x (0),y (0),z (0)) = (1.5,9,5), and the exponential distribution for the switching times of r (t ), with r (0) = 1.
Fig. 3. Sample path x (t ), y (t ), z (t ) for the stochastic virus infection model (3 ) for parameters λ 1 = 0.2134, λ 2 = 0.3340, β 1 = 0.6223, β 2 = 0.5159, δ 1 = 0.4123, β 2 = 0.2061, a 1 = 0.101, a 2 = 0.201, c 1 = 0.1100, and c 2 = 0.1150, with the initial value (x (0),y (0),z (0)) = (1.5,9,5).
|
Table 1. Some parameters of the system (2 ). All parameters are supposed to be nonnegative.


Set citation alerts for the article
Please enter your email address

© Copyright 2018-2021 | Chinese Laser Press. All Rights Reserved 沪ICP备15018463号-20