
Wanguo Zheng, Ping Li, Rui Zhang, Ying Zhang, Xuewei Deng, Dangpeng Xu, Xiaoxia Huang, Fang Wang, Junpu Zhao, Wei Han. Progress on laser precise control for high power laser facility[J]. High Power Laser and Particle Beams, 2020, 32(1): 011003
- High Power Laser and Particle Beams
- Vol. 32, Issue 1, 011003 (2020)
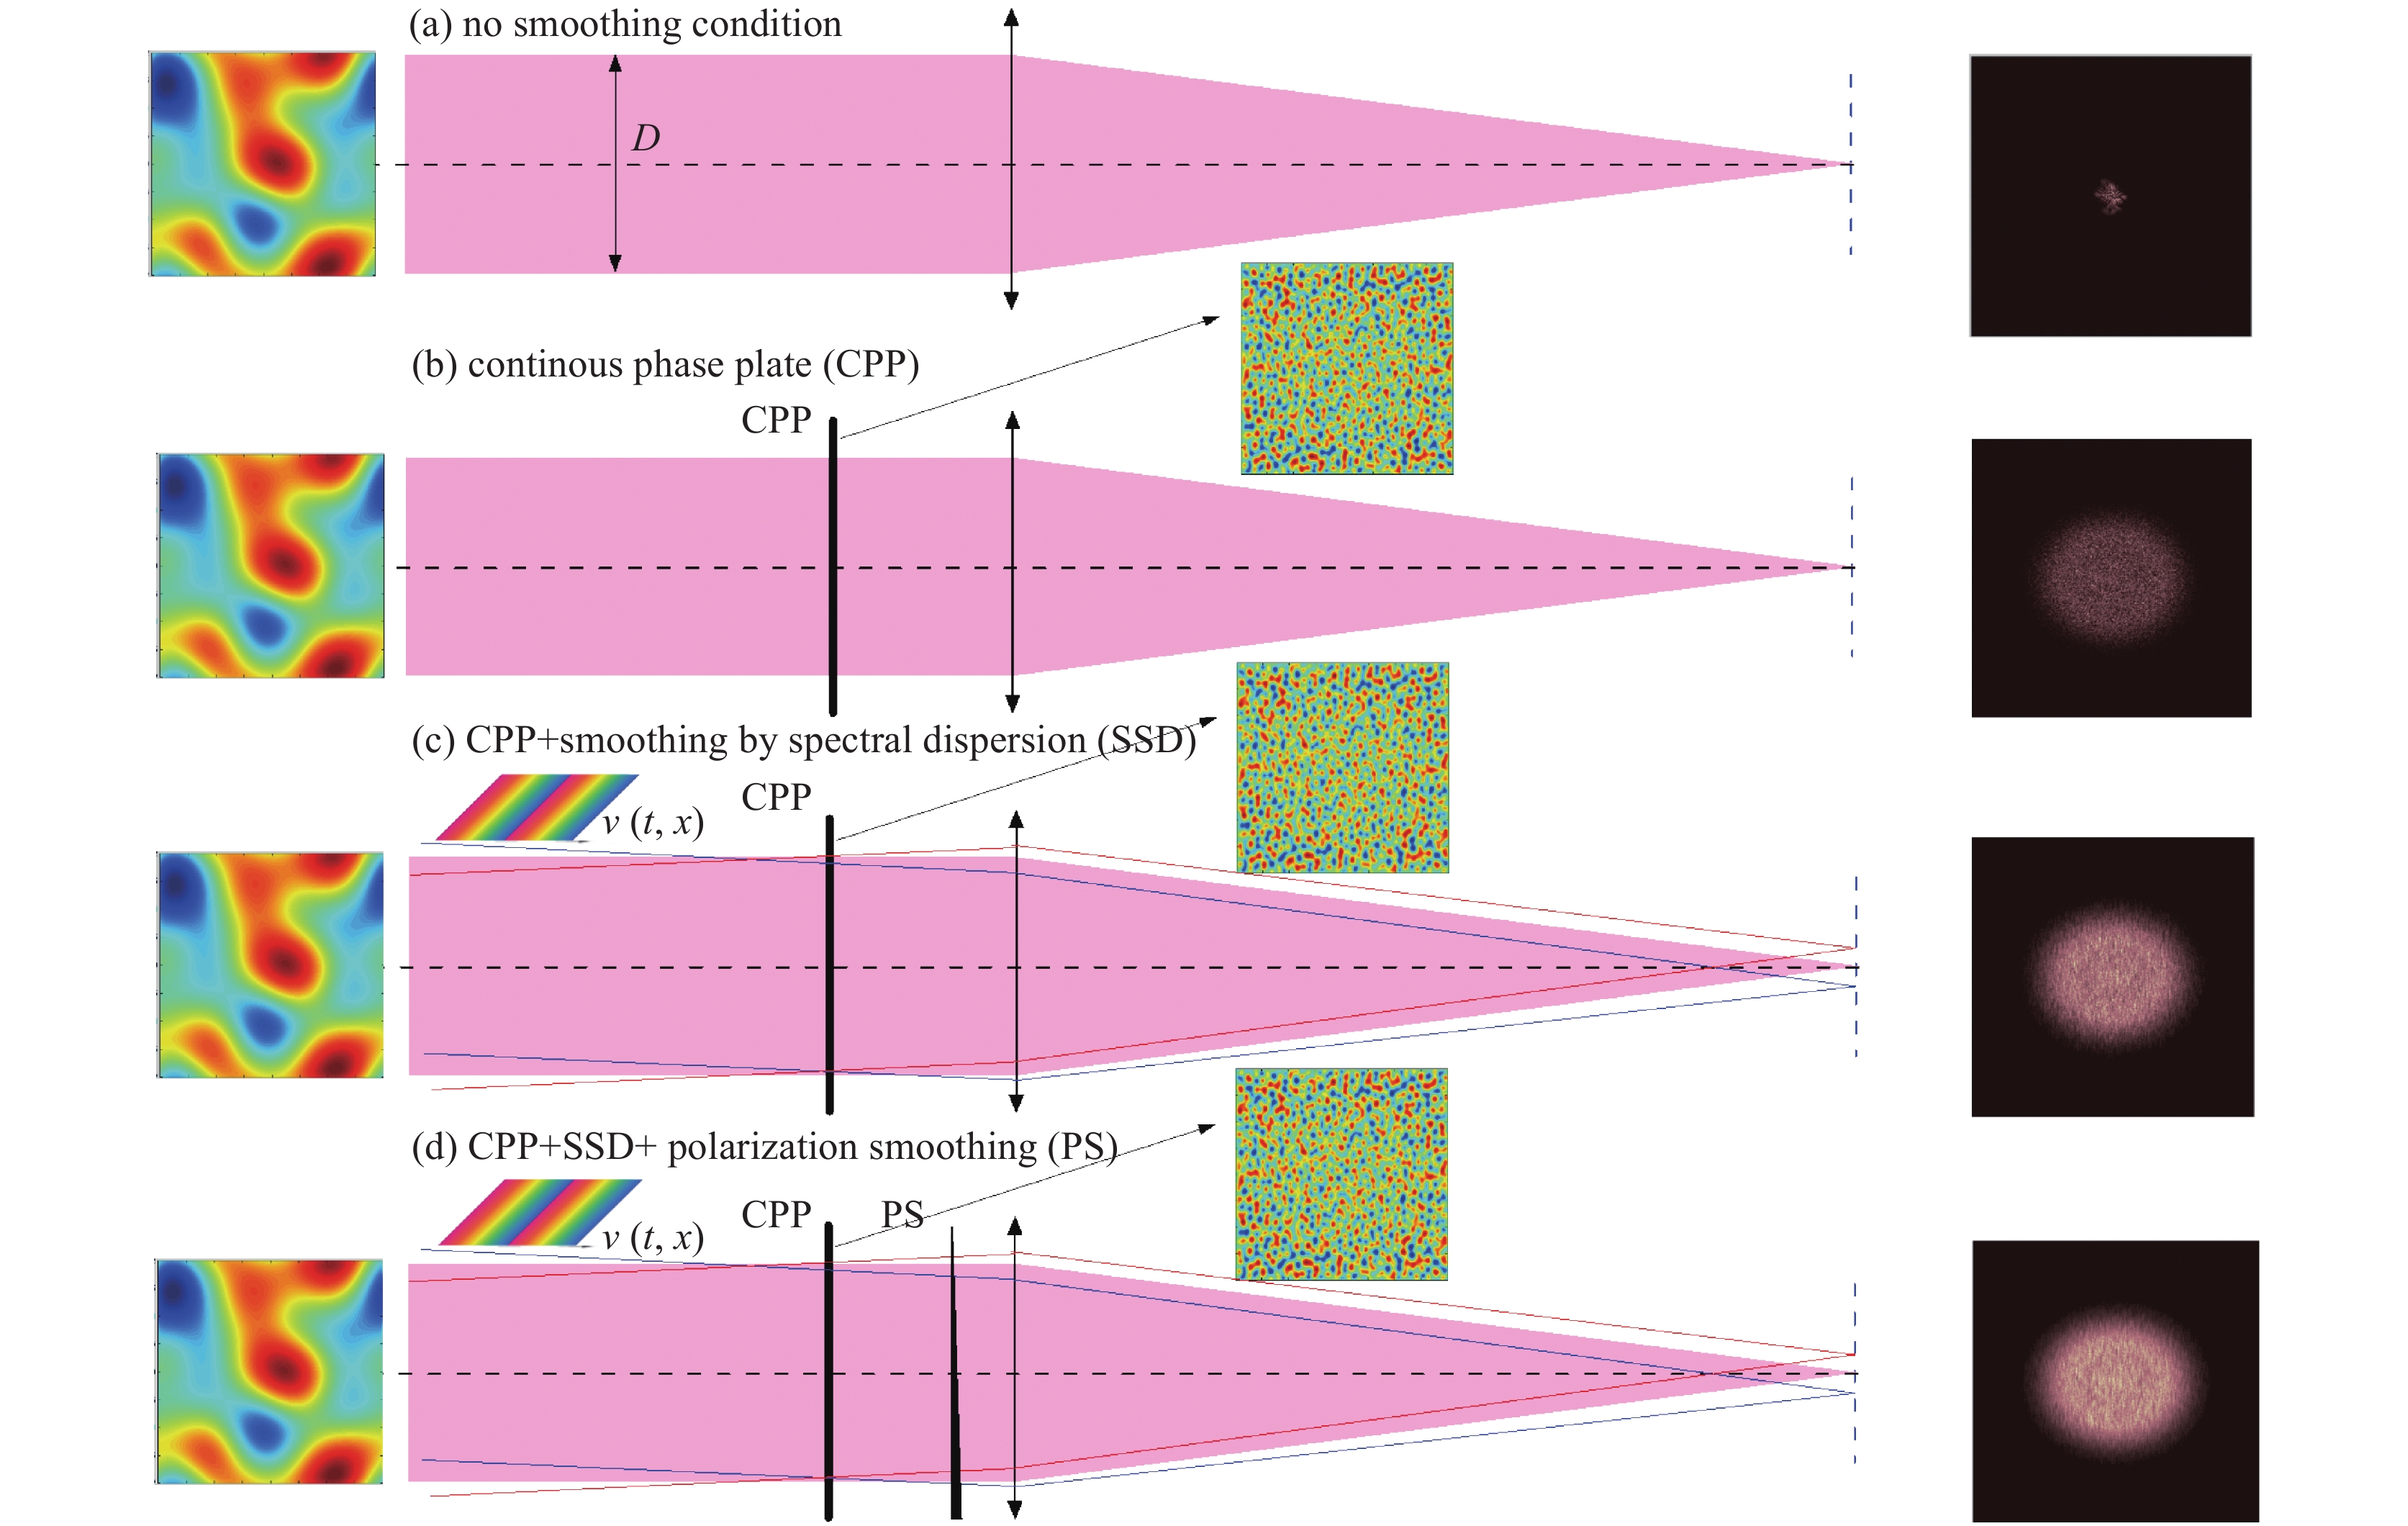
Fig. 1. Schematic diagram of focal-plane irradiance based on “CPP+SSD+PS” technology
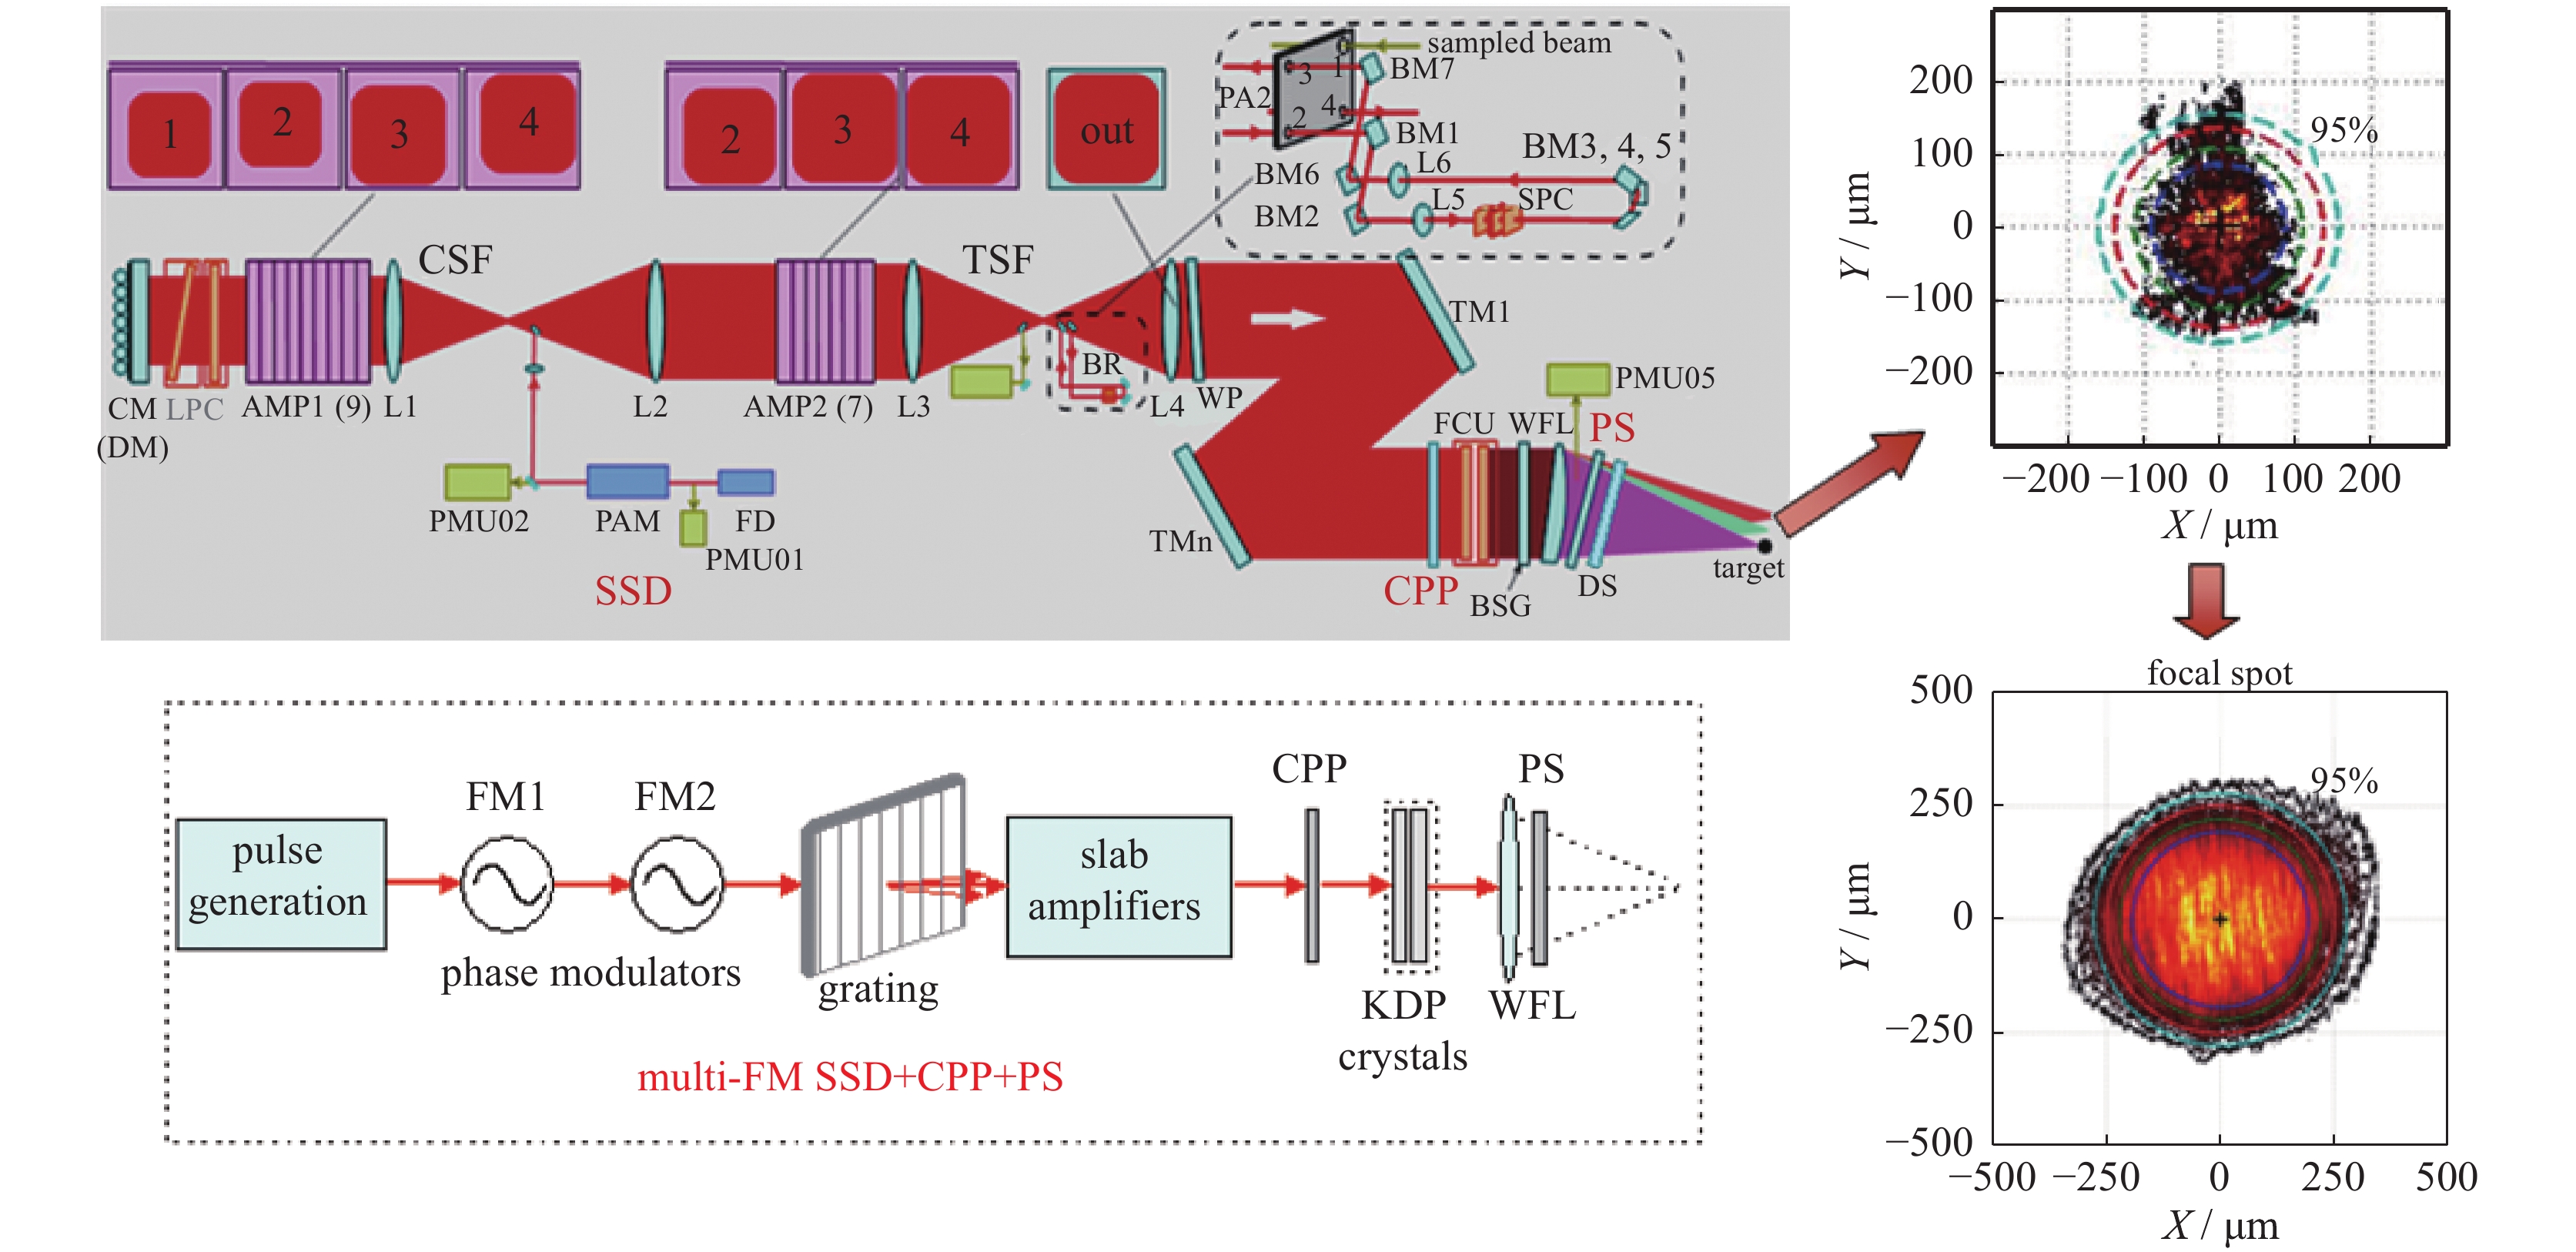
Fig. 2. Single beam smoothing technology applied to the laser facility
Fig. 3. Effect of single beam smoothing technology on the target irradiation
Fig. 4. Schematic diagram of optimizing bundle output based on independent beams
Fig. 5. Characterisitcs of interference fringes in the area of focal spot superposition for bundle laser
Fig. 6. Speckle distribution comparison of focal spots formed by different beams combinations: (a) and (b) have the same F number of beams but different bundle F number, (b) and (c) have the same bundle F number but different beams, F number
Fig. 7. Comparison of focal-plane irradiance distribution between single beam and 3×3 array bundle: (a) the focused single beam with a CPP, (b) the focused single beam with a CPP and SSD (c) the focused 3×3 array bundle beam with CPPs and SSD
Fig. 8. Schematic diagram of pulse precision shaping control principle
Fig. 9. Illustration of the broad range of pulse shapes applied to physical experiments in Shenguang (SG) series facilities: (a) high-contrast shock ignition pulse shape, (b) three-steps pulse shape, (c) hohlraum constant temperature pulse shape, (d) exponential (t 4) pulse shape
Fig. 10. Pulse control accuracy under ignition pulse output based on ITB facility
Fig. 11. Compensation effect of FM-to-AM based on birefringent polarization filtering technology: (a) pulse waveform before compensation, (b) pulse waveform after compensation
Fig. 12. (a) Schematic diagram of SSD beam focusing and (b) comparison of FM-to-AM between beam far-field and near-field for an SSD beam
Fig. 13. Beam shaping control diagram in near field of high power laser facility
Fig. 14. Near-field beam profiles of measurement: (a) 1ω laser and (b) 3ω laser at ignition pulse output based on ITB facility, (c) and (d) are the probability density functions of the fluence for (a) and (b) respectively
Fig. 15. Square of nonlinear spatial spectrum′s gain for high-power lasers with two-wavelengths
Fig. 16. (a) Schematic diagram of nonlinear propagation of two-wavelength beams in medium and (b) intensity lineout across the output near-field image of the two-wavelength beams
Fig. 17. (a) Phase defect detection platform and (b) typical detection data
Fig. 18. Intense laser propagation characteristics introduced by phase defect point
Fig. 19. (a) Approximation of beam propagation in hohlraum. (b) Two overlapped beams pass through the LEH and reach the hohlraum wall (Beam overlapping volume is emphasized with dark color)
Fig. 20. Some focal spots, including circular spot, elliptical spot and special shape spot, are proposed to reduce the degree of beam overlap. The dashed circle shows the maximal area limited by LEH
Fig. 21. (a) The designed CPP that produces a super-Gaussian of order sg=6 with special laser spot in the far field. (b) Speckled far-field intensity patterns produced by the full aperture illumination of the CPP
Fig. 22. Polarization distribution of beam passing through polarization plate. (a) wedge polarization crystal, (b) crystal with random phase distribution
Fig. 23. Focal spot PSDs corresponding to different polarization smoothing

Set citation alerts for the article
Please enter your email address
© Copyright 2018-2021 | Chinese Laser Press. All Rights Reserved 沪ICP备15018463号-20