
Jiefei Han, Bobo Lian, Liying Sun. Adaptive Construction Method for Binary Measurement Matrix Based on Deep Learning[J]. Laser & Optoelectronics Progress, 2021, 58(22): 2220001
- Laser & Optoelectronics Progress
- Vol. 58, Issue 22, 2220001 (2021)
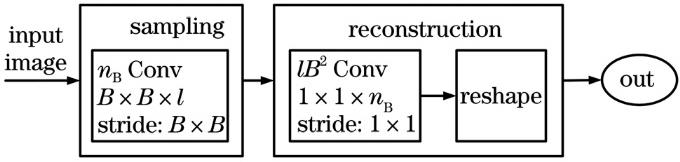
Fig. 1. Sampling network model based on deep learning
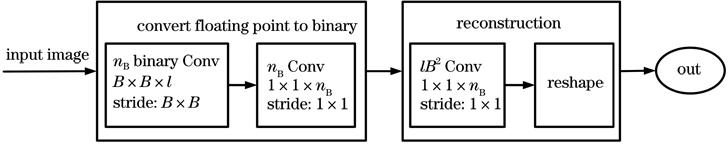
Fig. 2. Binary sampling network model based on deep learning
Fig. 3. Original images used in simulation experiment. (a) Ball; (b) Face
Fig. 4. Simulation results of different measurement matrices. (a)--(f) Results of random Gaussian matrix; (g)--(l) results of Toeplitz matrix; (m)--(r) results of Hadamard matrix; (s)--(x) results of proposed matrix
Fig. 5. Ghost imaging system structure based on compressed sensing. (a) Principle diagram; (b) picture
Fig. 6. Target images of laser imaging experiment. (a) Target1; (b) Target2
Fig. 7. Results of laser imaging under different sampling rates. (a)--(f) Results of random Gaussian matrix; (g)--(l) results of Toeplitz matrix; (m)--(r) results of Hadamard matrix; (s)--(x) results of proposed matrix
| |||||||||||||||||||||||||||||||||||||||||
Table 1. PSNR results of different measurement matrices under different sampling rates
| |||||||||||||||||||||||||||||||||||||||||
Table 2. SSIM results of different measurement matrices under different sampling rates
| |||||||||||||||||||||||||||||||||||||||||
Table 3. PSNR of laser imaging results under different measurement matrices
| |||||||||||||||||||||||||||||||||||||||||
Table 4. SSIM of laser imaging results under different measurement matrices

Set citation alerts for the article
Please enter your email address
© Copyright 2018-2021 | Chinese Laser Press. All Rights Reserved 沪ICP备15018463号-20