
Dekui Li, Chenxiang Xu, Bing Lin, Kai Guo, Ning Zhang, Jun Gao, Zhongyi Guo. Research progress on theory and applications of index of polarization purities[J]. Infrared and Laser Engineering, 2022, 51(3): 20210373
- Infrared and Laser Engineering
- Vol. 51, Issue 3, 20210373 (2022)
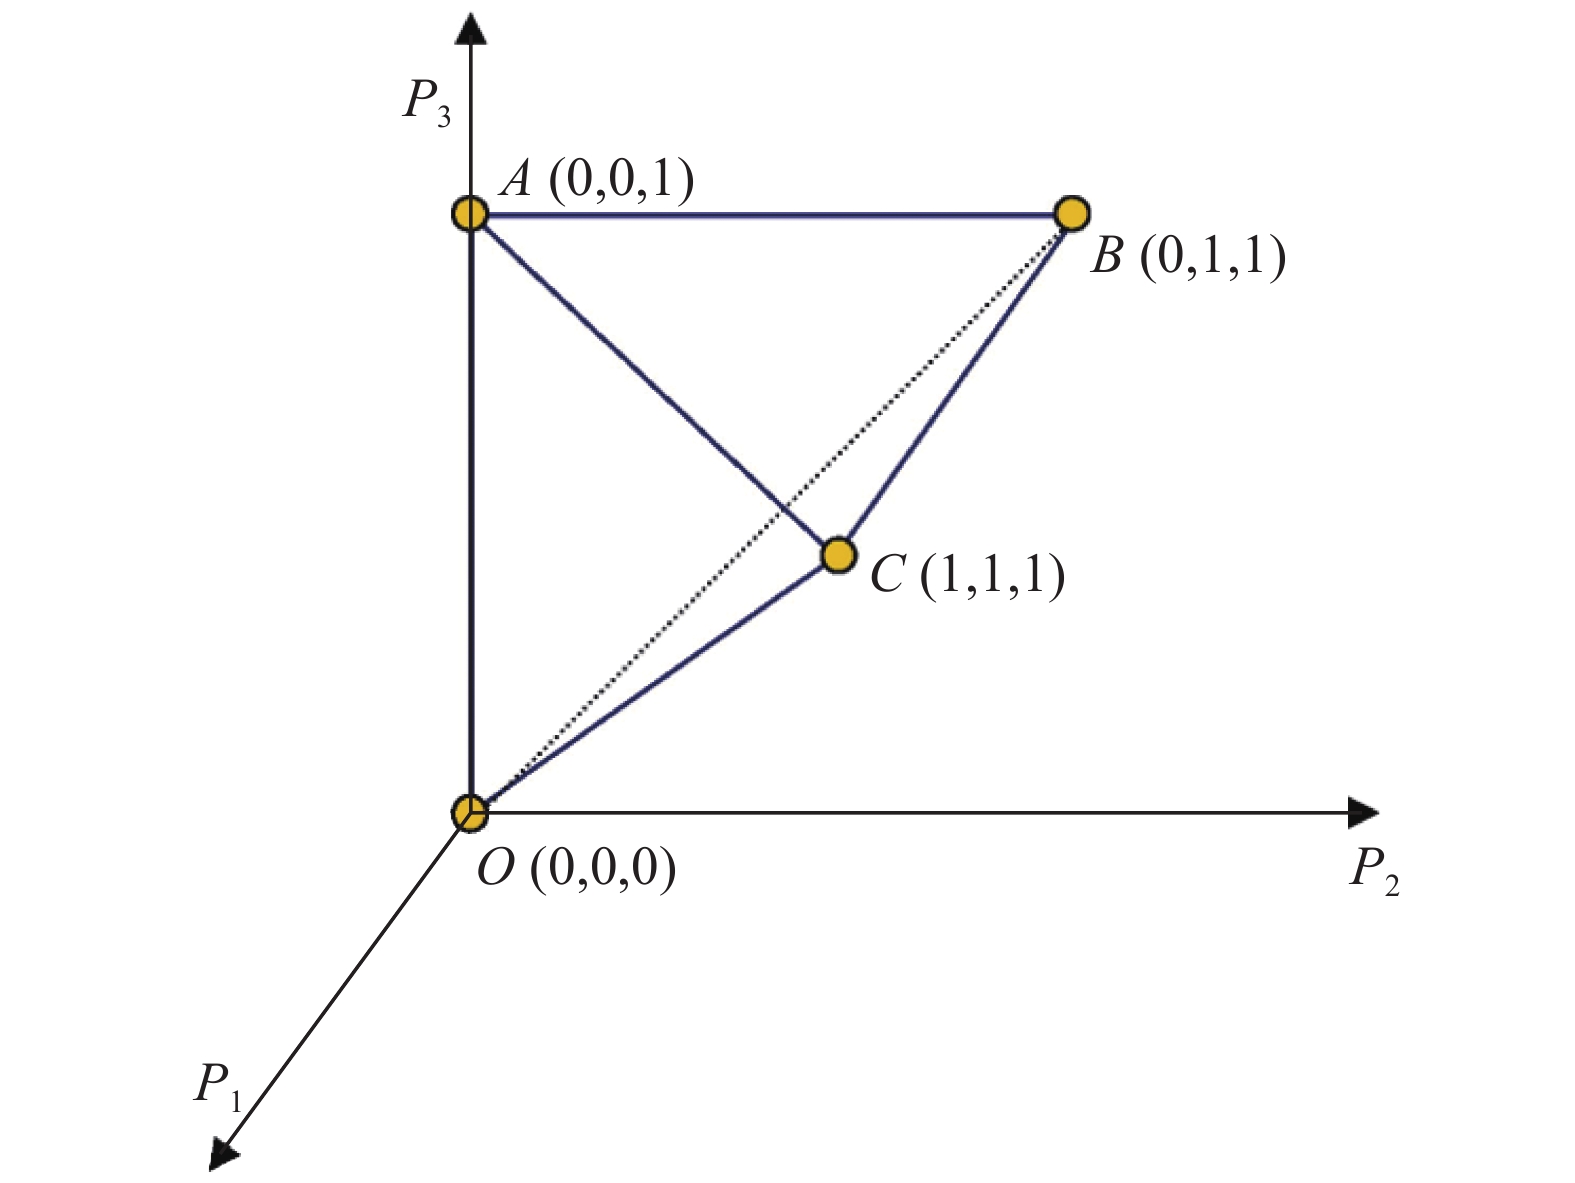
Fig. 1. IPPs’ feasible region
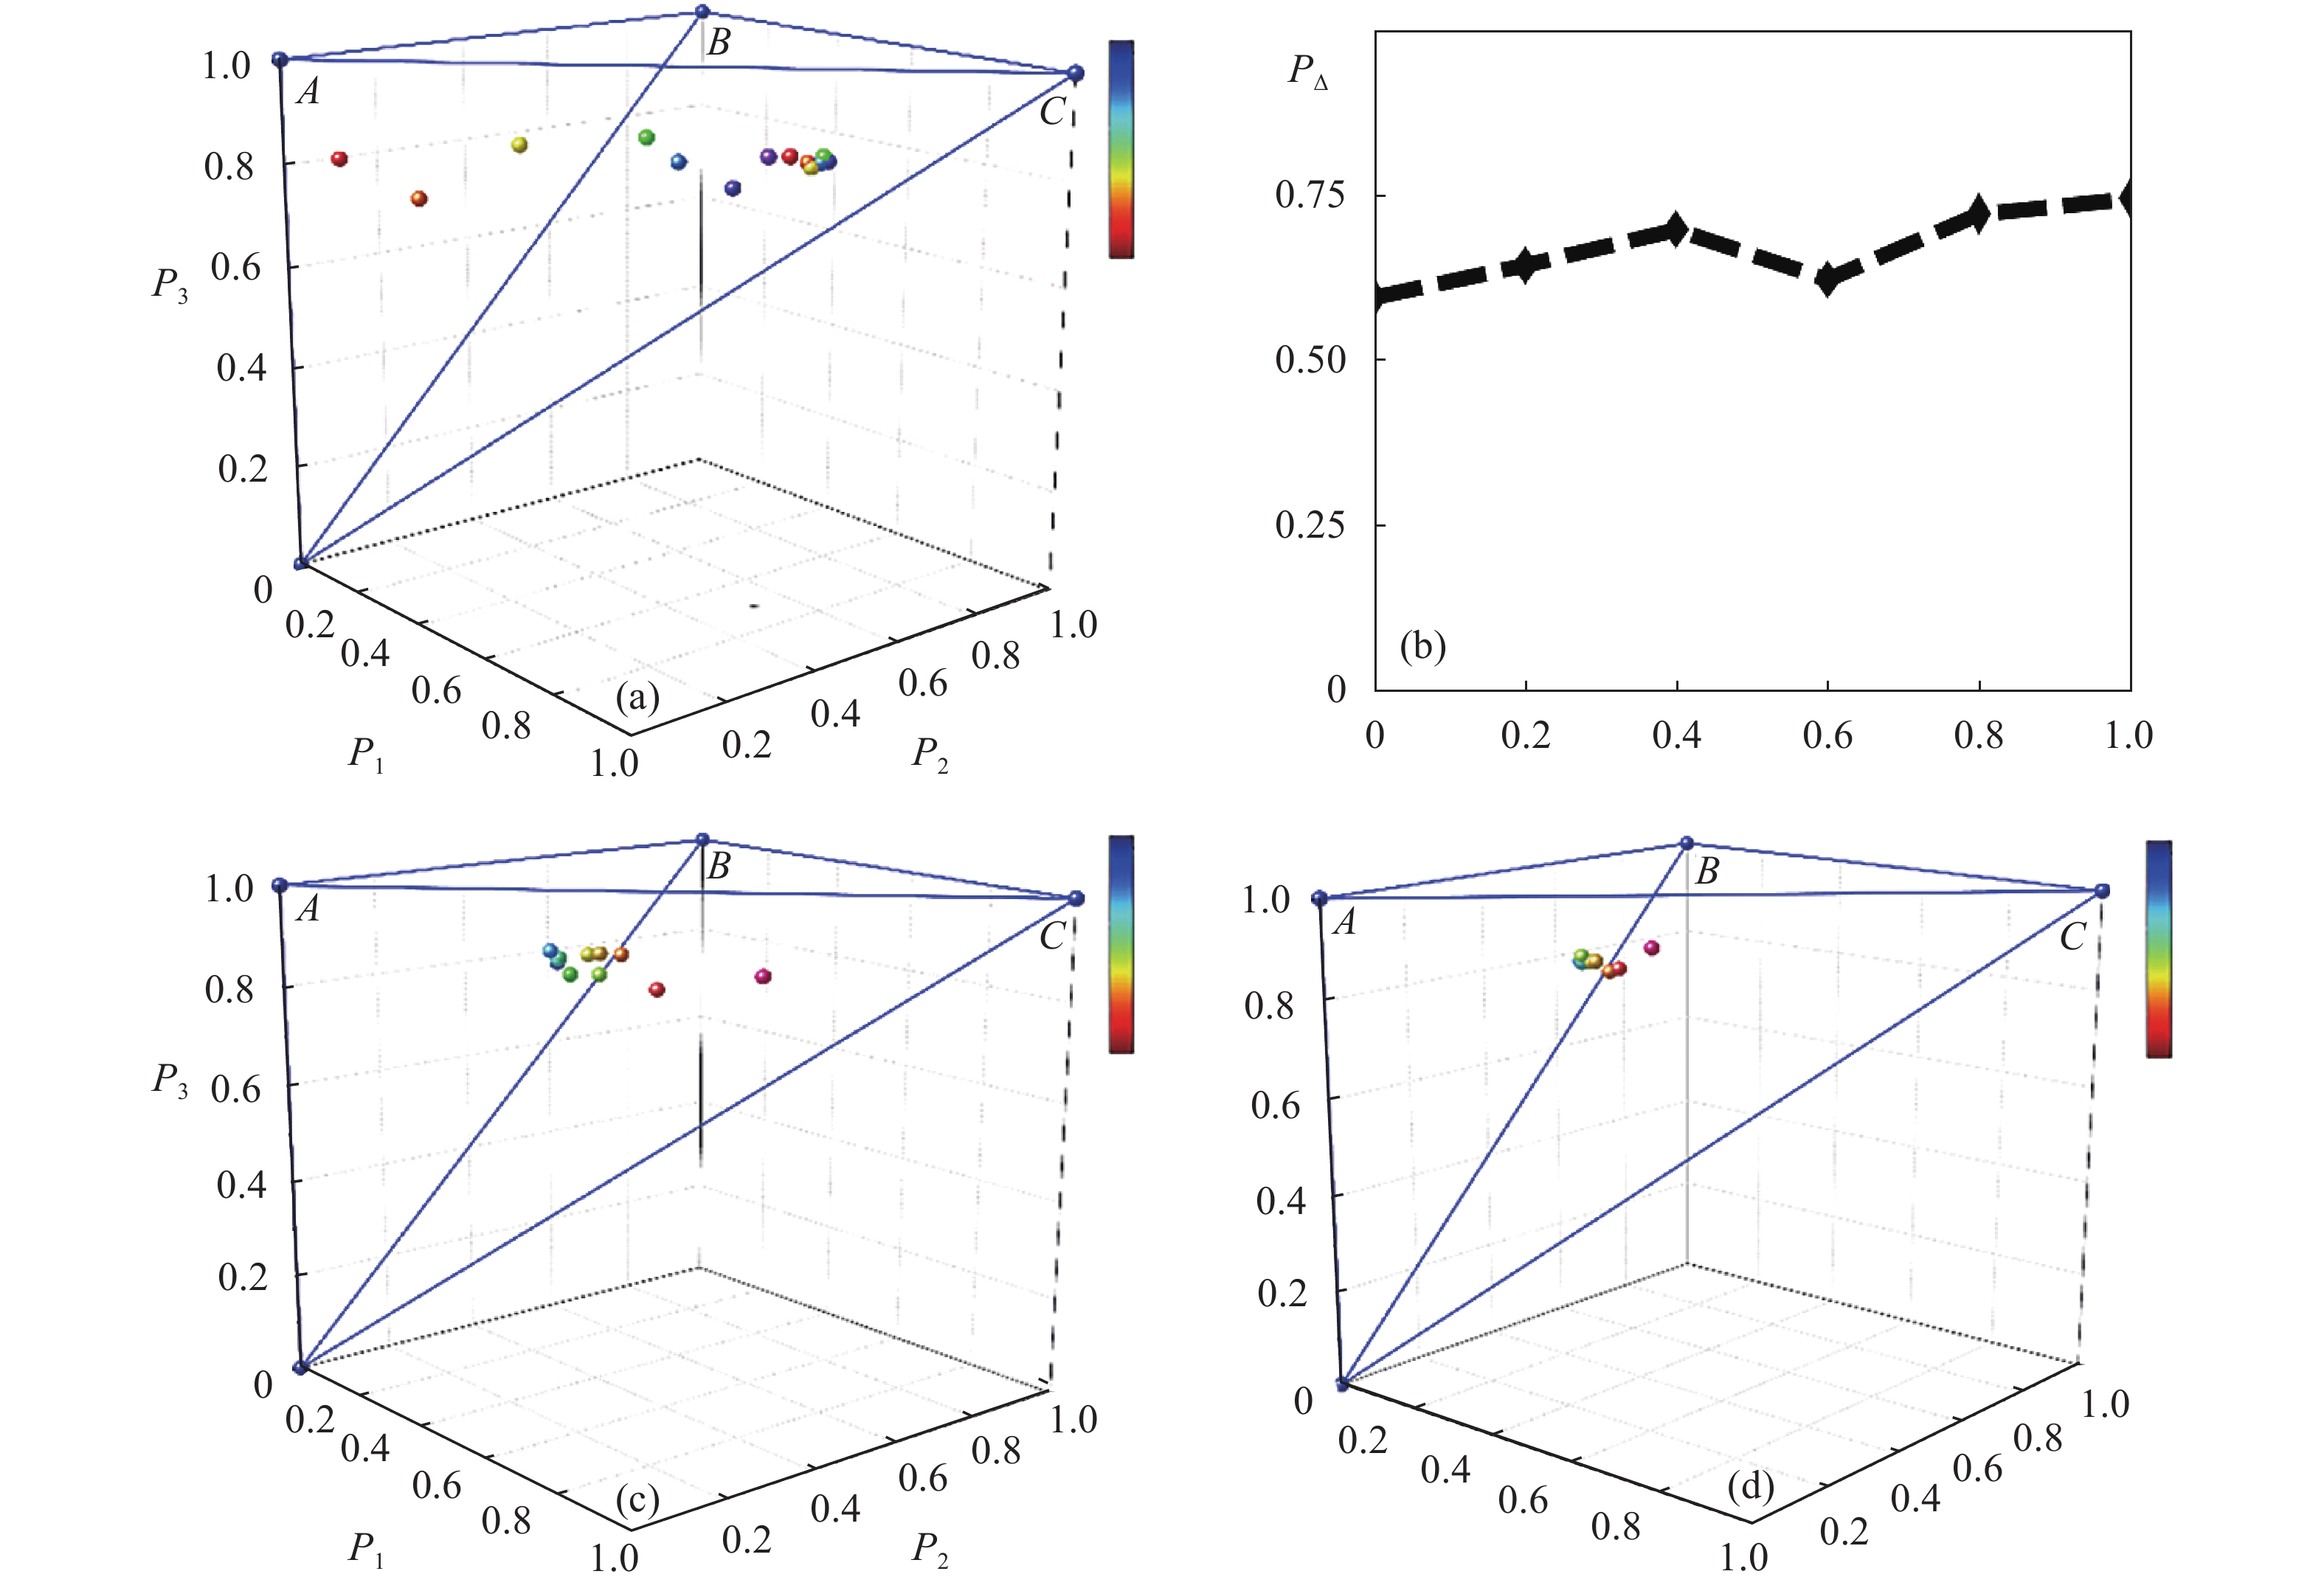
Fig. 2. (a)
,
,
varying with the proportion of small particles in the purity space (backward detection); (b)
of scattering medium as a function of the proportion of small particles (forward detection); (c)
,
,
varying with different mean values for standard deviation of 0.01 μm (backward detection); (d)
,
,
varying with different mean values for standard deviation of 1.05 μm (backward detection)
(a)
、
、
随大小微粒混合体积比的变化(后向探测);(b)大小微粒混合体积比对散射介质的退偏指数
的影响(前向探测);(c)粒子标准差为0.01 μm时,
、
、
随粒子均值的变化(后向探测);(d) 粒子标准差为1.05 μm时,
、
、
随粒子均值的变化(后向探测)
Fig. 3. Polarization analysis of leaf. (a) Intensity; (b)
; (c)
; (d)
–
; (e) Linear retardance δ and (f) Pseudo-colored image of linear retardance
植物叶子的偏振分析。(a) 强度;(b)
;(c)
;(d)
-
;(e) δ 线性延迟;(f) 线性延迟的伪彩色图像
Fig. 4. Pseudo-colored image of different bases and weights. (a) α 1 = 3, α 2 = 1 and α 3 = 1 of Eq. (11); (b) α 1 = 2, α 2 = 2 and α 3 = 1 of Eq. (12)
Fig. 5. P 1 and DoP varying with GC (forward scatter)
Fig. 6. [in Chinese]
Fig. 6. Space distribation and frequency distribution histogram of
of detecting board with four kinds of GCs
四种不同GC溶液下探测板(200×200)的
空间分布和
的频率分布直方图
Fig. 7. (a) Model of refraction and reflection; (b) Top view of upper hemisphere
Fig. 8. Distributions of
,
,
corresponding to different incident angles. (a) Samples as Cu, Au, Al; (b) Samples as Al, Al2O3随着入射角的变化,不同目标的
、
、
在纯度空间下的分布。(a) Cu、Au、Al;(b) Al、Al2O3
Fig. 9. ,
,
of each grid in the upper hemisphere varying with the incident angles (Cu)
、
、
上半球的每个网格分布随入射角的变化(Cu)


Set citation alerts for the article
Please enter your email address

© Copyright 2018-2021 | Chinese Laser Press. All Rights Reserved 沪ICP备15018463号-20