• Chinese Optics Letters
  • Vol. 13, Issue 4, 040402 (2015)
Fugui Yang, Qiushi Wang, and Ming Li*
Author Affiliations
  • Laboratory of X-ray Optics and Technologies, Beijing Synchrotron Radiation Facility, Institute of High Energy Physics, Chinese Academy of Sciences, Beijing 100049, China
  • show less
    DOI: 10.3788/COL201513.040402 Cite this Article Set citation alerts
    Fugui Yang, Qiushi Wang, Ming Li. Light source system for high-precision flat-field correction and the calibration of an array detector[J]. Chinese Optics Letters, 2015, 13(4): 040402 Copy Citation Text show less
    Optical schematic of the calibration source system. The cavity, which is made of a highly reflective material, is filled with a scattering medium.
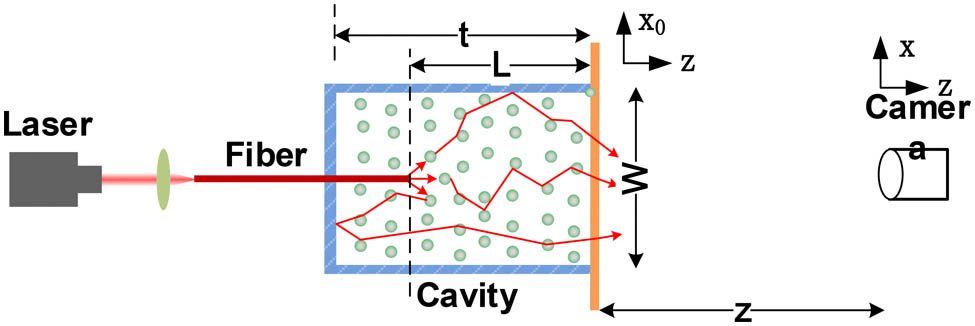
    Fig. 1. Optical schematic of the calibration source system. The cavity, which is made of a highly reflective material, is filled with a scattering medium.
    Values of transmittance (solid line), cavity absorption (dashed line) and medium absorption (dashed–dotted line) as predicted by the Monte Carlo simulation at varying cavity widths. Each curve corresponds to (a) different cavity reflectivities R=0.90 (○), 0.95 (▽), 0.98 (□), and 1.00 (⋄), respectively, in the case of L=0.5 cm, and l*=100 μm; (b) different transport mean free paths l*=50 (○), 100 (▽), and 200 μm (□), respectively, in the case of R=0.98. The values of L in graph (b) meet the condition L/l*=const in order to maintain the correlation time for each curve.
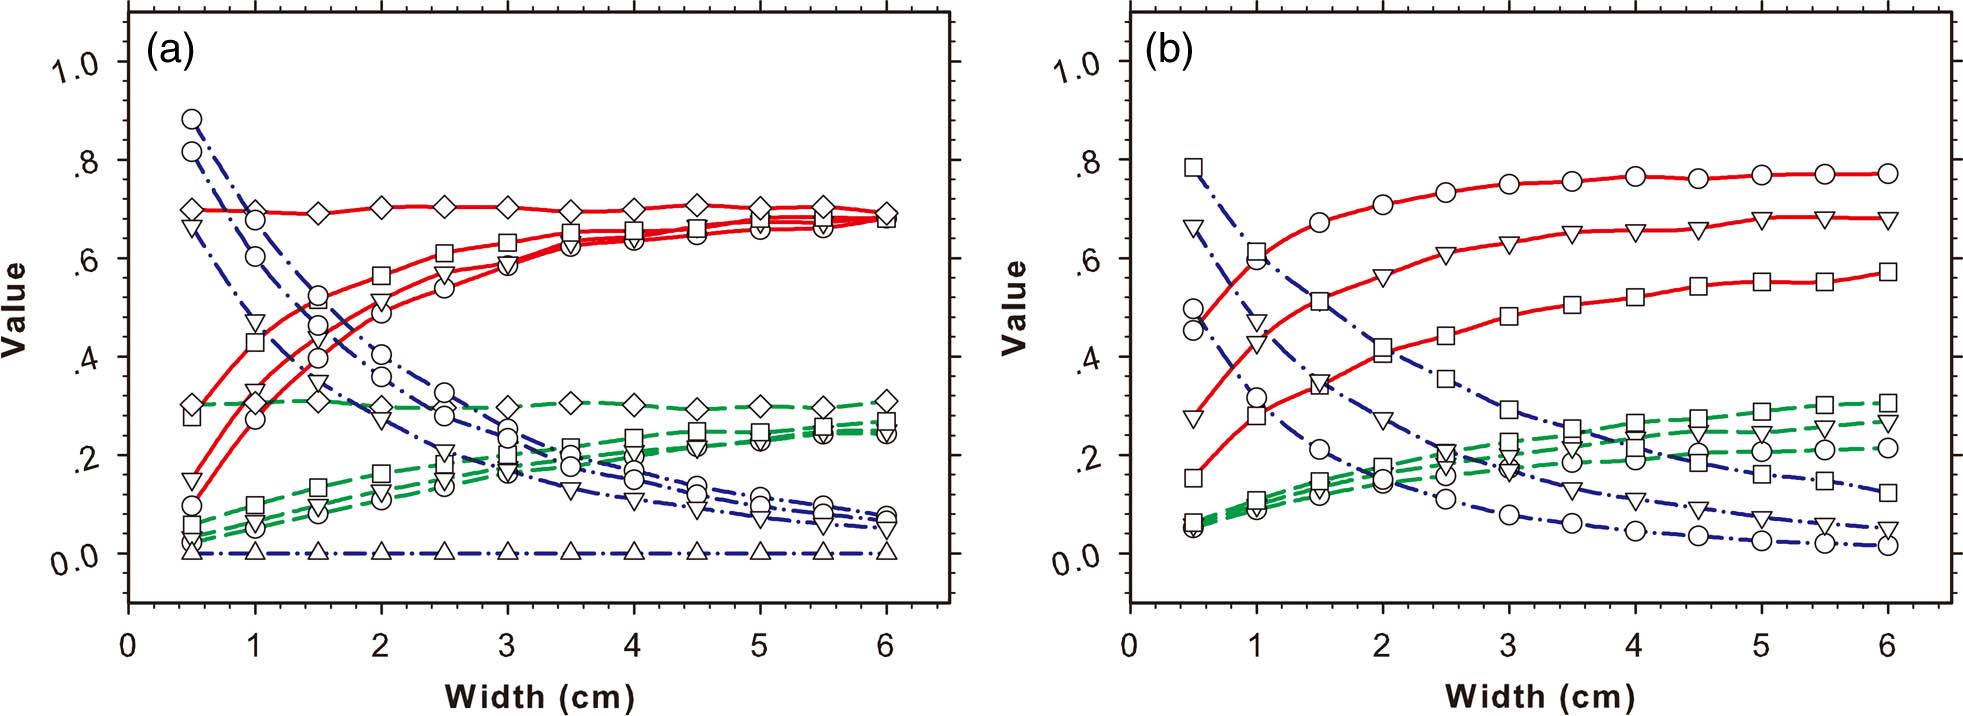
    Fig. 2. Values of transmittance (solid line), cavity absorption (dashed line) and medium absorption (dashed–dotted line) as predicted by the Monte Carlo simulation at varying cavity widths. Each curve corresponds to (a) different cavity reflectivities R=0.90 (○), 0.95 (▽), 0.98 (□), and 1.00 (⋄), respectively, in the case of L=0.5cm, and l*=100μm; (b) different transport mean free paths l*=50 (○), 100 (▽), and 200 μm (□), respectively, in the case of R=0.98. The values of L in graph (b) meet the condition L/l*=const in order to maintain the correlation time for each curve.
    Values of transmittance (solid line), cavity absorption (dashed line), and medium absorption (dashed–dotted line) versus the cavity length t. Each curve corresponds to different cavity reflectivities. R=0.90 (○), 0.95 (▽), 0.98 (□), and 1.00 (⋄), respectively, at two different transport mean free paths (a) l*=100 μm and (b) l*=25 μm. The values of L=5 mm and W=3 cm are used here.
    Fig. 3. Values of transmittance (solid line), cavity absorption (dashed line), and medium absorption (dashed–dotted line) versus the cavity length t. Each curve corresponds to different cavity reflectivities. R=0.90 (○), 0.95 (▽), 0.98 (□), and 1.00 (⋄), respectively, at two different transport mean free paths (a) l*=100μm and (b) l*=25μm. The values of L=5mm and W=3cm are used here.
    Flatness of the far field for different extended source sizes W and distances z. An extremely low non-uniformity is obtained around the central region.
    Fig. 4. Flatness of the far field for different extended source sizes W and distances z. An extremely low non-uniformity is obtained around the central region.
    Measure of non-uniformity after averaging multiple measurements with the use of our detector.
    Fig. 5. Measure of non-uniformity after averaging multiple measurements with the use of our detector.
    Fugui Yang, Qiushi Wang, Ming Li. Light source system for high-precision flat-field correction and the calibration of an array detector[J]. Chinese Optics Letters, 2015, 13(4): 040402
    Download Citation