Laboratory of X-ray Optics and Technologies, Beijing Synchrotron Radiation Facility, Institute of High Energy Physics, Chinese Academy of Sciences, Beijing 100049, China
Fugui Yang, Qiushi Wang, Ming Li, "Light source system for high-precision flat-field correction and the calibration of an array detector," Chin. Opt. Lett. 13, 040402 (2015)
Copy Citation Text
Signal distortion due to the non-uniform response of the detector degrades the measurement accuracy of most metrology instruments. In this Letter, we report a newly developed calibration source system for reference-based non-uniformity correction using a laser source, a fiber, and a diffusive module. By applying the Monte Carlo simulation, we show that the transmittance of the system highly depends on the cavity reflection of the diffusive module. We also demonstrate the use of this system to achieve a flat field at a very low non-uniformity (less than 0.2%) with proper illumination intensity, which most costly commercial integrating sphere systems traditionally cannot provide.
The photoresponse non-uniformity of an array detector is crucial to a high-precision optical measurement because the distorted output signal deviates the actual incident light field of the detector, thus reducing the accuracy of the measurement. For instance, the photoresponse non-uniformity at a 2% root mean square (rms) in the long-trace profiler (LTP) leads to a measurement uncertainty of the surface slope of 0.3 μrad rms[1]. This is much higher than the 0.05 μrad rms required by X-ray optics in third- or fourth-generation synchrotron sources. Despite the advances in detector technology in recent years, photoresponse non-uniformity continues to be a serious challenge.
To decrease the amount of error, non-uniformity correction (NUC) techniques have been developed and implemented to perform the necessary calibration over the years. These correction techniques are grouped into two primary categories[2], scene-based and reference-based correction. Scene-based NUC techniques, such as the constant statistics method[3] and neural-network-based NUC[4], estimate the non-uniformity and correct the image based on the motion in the acquired video or image sequences. These methods are capable of recalibrating the sensor for parameter drift and have been widely used in machine vision and IR sensing applications. However, they suffer from either motion-dependent or high computational complexity[5], both of which limit their applications in high-precision optical measurement. Reference-based NUC techniques based on the use of uniform sources are attractive methods of ensuring calibration accuracy. The most commonly used technique is the two-point correction method[6–8], which employs at least two pictures at different illuminances to calculate the exact gain and offset of each pixel on the detector array. This method is easy to implement and to integrate with hardware. However, a flat field generated by a uniform radiation source, such as an expensive integrating sphere, is critical for achieving a high correction accuracy. Commercial integrating spheres with a luminance non-uniformity of 1%–2% rms[9] obviously cannot meet the requirements of calibration accuracy set forth by the LTP[10]. Moreover, considering the wavelength-dependent quantum efficiency of the detector[11–13], the spectrum of the light in the calibration system should be same as that of the metrology instrument. Thus, laser speckle becomes problematic if a highly coherent light is used.
In this Letter, we introduce a newly developed calibration source system using diffuse optics. The source system generates a flat field with a low laser-speckle contrast due to the Brownian motion of the scattering particles[14]. Diffuse optics[15] have been proven to be useful in quantitatively assessing the parameters of a colloidal solution. The novelty of this work lies in the composition of the system, which was designed by the Monte Carlo simulation and the diffusion theory. These were used in order to maintain both a high transmittance (or a low power consumption) and a low laser-speckle contrast. We demonstrate that the new system is a robust and inexpensive approach to achieving calibration accuracy below 0.2% rms. We stress that the limited output light power of most stabilized laser sources and the light loss due to the diffusion/absorption determine that transmittance is the primary aim of this work.
Sign up for Chinese Optics Letters TOC. Get the latest issue of Chinese Optics Letters delivered right to you!Sign up now
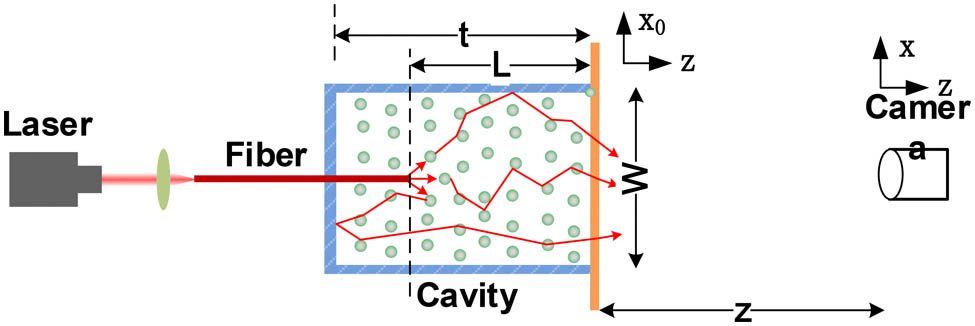
Figure 1 illustrates the schematic of the new calibration source system. A laser diode (HL63163DG, OCLARO) and its controller (ComboSource 6310, Arroyo), including a high-accuracy laser driver and a powerful temperature controller, provide stable light at the wavelength of to imitate a He–Ne laser. The collimated laser is coupled into a multi-mode optical fiber with a core diameter of 400 μm, and then delivered into the diffusive module, which is comprised of a diffuse-reflective cavity, and suspended in it. The inner surface of the cavity, excluding its light output window, have a high reflectivity. We use a concentrated aqueous suspension of sub-micro-size TiO2 particles as scattering medium to fill the cavity. A surfactant is added to stabilize the suspension against aggregation. After multiple scattering processes, the output diffused light forms a uniform light field (or target field) at location . The uniformity is restrained by two errors, which are characterized by different spatial frequency domains. One error is light field’s “roughness,” which is caused by the laser speckle from the coherent characterization of light. It is well known that the laser-speckle contrast scales as [14], where is the number of independence patterns recorded during the exposure. In our case, is the ratio of the exposure time to the correlation time of the diffused light , which can be given according to the diffuse wave theory, [15], where is the transport mean free path. is the distance from fiber’s output end to the light output window of the cavity, and , with wavelength number and diffusion coefficient , is the diffusion time. The other factor is the light field’s “flatness,” which is due to the angular distribution of the diffused light. Considering the one-dimensional case, the spatial distribution on the target field is computed from where represents the intensity pattern on the cavity output window, and is the angularly resolved diffuse transmittance at . Similar to LED sources or scattering surfaces, the function displays a good gradient in the central zone (i.e., the small angle region), which beneficial to the generation of the uniform field. The distance must be optimized to constrain the target field within a small angle range relative to the cavity output window while maintaining the essential illuminance. Overall, the laser-speckle suppression and the light field’s flatness are primary problems that are resolved in this Letter.
Figure 1.Optical schematic of the calibration source system. The cavity, which is made of a highly reflective material, is filled with a scattering medium.
The Monte Carlo simulation is performed to predict the effect of the system parameters on the performance of the system. Our goal is to use this information to guide an optimized design of the system. Some modifications of the program—Monte Carlo modeling of photon transport in multi-layered tissues (MCML)[16] are made to accommodate the characteristics of the inner walls of the cavity by adding reflection and the boundary locations. Figure 2(a) graphically shows the influence of inner reflectivity on the transmittance in the cases of absorption, scattering, and anisotropy, with coefficients of [17], , and , respectively. It illustrates that a lower reflectivity significantly reduces the transmittance, especially for a narrow cavity. This is due to the fact that a narrow cavity causes the occurrence of more light reflected on the side-wall, and much more energy loss. Meanwhile, the medium absorption increases, as less light is transported in the medium cavity. However, a very wide cavity is not favored in our system, because of the unacceptable non-uniformity of the target field, which due to the extension of the diffused light field angle, according to Eq. (1). It is also demonstrated that the absorption or transmittance of the side-wall is a serious problem compared to the medium absorption with a maximum value of 0.3 (corresponding to ) in the configured system. Figure 2(b) further shows the transmittance as a function of or , for which the relationship is used to determine from for each curve, or reversely, in order to keep a constant correlation time. We could see that the short distance or the transport mean free path is beneficial for transmittance. It is beneficial because less absorption by the inner wall of the cavity means less light will reach the side-wall for a short . However, note that a short certainly poses new challenges in preparing the condensed solution, considering the aggregation problems of nano-particles[18].
Figure 2.Values of transmittance (solid line), cavity absorption (dashed line) and medium absorption (dashed–dotted line) as predicted by the Monte Carlo simulation at varying cavity widths. Each curve corresponds to (a) different cavity reflectivities (○), 0.95 (▽), 0.98 (□), and 1.00 (⋄), respectively, in the case of , and μ; (b) different transport mean free paths (○), 100 (▽), and 200 μm (□), respectively, in the case of . The values of in graph (b) meet the condition in order to maintain the correlation time for each curve.
For the simulation in Fig. 1, the length of the cavity is long enough that fewer photons will arrive at the bottom of the cavity, and the energy loss due to the back wall of the cavity can be neglected. However, some interesting phenomena appear as the value of becomes comparable with . Figures 3(a) and 3(b) display the results for transmittance, medium absorption, and cavity absorption for different reflectivities . The computation in Fig. 3(a) shares the same medium with Fig. 2(a), but keeps the cavity width constant (e.g., 3.0 cm). The curves of transmittance exhibit a reverted discipline when comparing the cases of with . When the value of is less than 0.98, the dramatic decrease in the cavity absorption indicates that the absorption of the back wall dominates the energy loss for a short . A long cavity (e.g., ), where the medium absorption tends to be a constant value, is preferable for low reflectivity. A similar result was obtained in the experiment by Redding et al.[19]. However, as opposed to the conclusion reached by Redding et al., we find that it is difficult to increase the transmittance to as high as the value predicted in that paper, due to the absorption of the water and the cavity. For a high reflectivity (e.g., 0.98, 0.99), a shorter transmits more photons, while making negligible changes to the cavity’s absorption. This enhanced effect can be well explained in that most of the back-scattered light is reflected and transmitted through the layer. Considering the medium absorption, a short is beneficial for enhancing the system’s performance. Furthermore, we reduce the transport mean free path from 100 to 25 μm, while keeping other parameters unchanged. The results in Fig. 3(b) show that the requirement of the cavity reflectivity for enhanced transmittance at the short cavity length increases (i.e., ). Moreover, the contribution of medium absorption dominates the energy loss rather than the cavity absorption, which is different from that shown in Fig. 3(a). However, we should mention the difficulty in finding materials with a very high reflectivity, and that the high cost of such materials prevent their application in detector calibration. Overall, the careful choice of the geometric structure of system at the given reflectivity and the transport mean free path , including the cavity and the location of the fiber, is essential for highly efficient light transmittance.
Figure 3.Values of transmittance (solid line), cavity absorption (dashed line), and medium absorption (dashed–dotted line) versus the cavity length . Each curve corresponds to different cavity reflectivities. (○), 0.95 (▽), 0.98 (□), and 1.00 (⋄), respectively, at two different transport mean free paths (a) μ and (b) μ. The values of and are used here.
Besides a low speckle contrast, a flat far-field is the other equally important limitation in forming uniform illumination, according to Eq. (1). A large number of numerical calculations, which are not presented here, have shown that the angularly resolved diffuse transmittance function is independent of the medium parameters. In our study, computations of the function by the Monte Carlo simulation are performed at , μ, and . Figure 4 shows the non-uniformity of the light field located at and 40 cm with different cavity widths . We can see the non-uniformity is not sensitive to the cavity width, and poses no extra limitations on the cavity width . Therefore, it is beneficial for system optimization. However, the non-uniformity decreases significantly as the field plane of interest moves away from the cavity. We should pay more attention to the reduction of the illuminance during this process. The lowest requirement of the illuminance is the number of photons needed for the saturated signal, which is related to the full well capacity and the quantum efficiency of the calibrated detector. A non-uniformity of less than 0.1% can be obtained in a field with a radius of 20 mm. For a lower non-uniformity, a high-power laser and a large distance are necessary.
Figure 4.Flatness of the far field for different extended source sizes and distances . An extremely low non-uniformity is obtained around the central region.
To demonstrate the performance of the technique, we set up the apparatus seen in Fig. 1. The cylindrical cavity is made of polytetrafluoroethene with , , and at a wavelength of 632 nm. The concentration of TiO2 particles, which is 290 nm in diameter, as measured by the dynamic light-scattering instrument, is at a volume fraction of 0.53% and does not show visible aggregation within 20 h. This specification gives a transport mean free path of 400 μm[20] and a correlation time of 100 ns at . A custom-designed cover system is used to prevent environmental light noise. A CCD camera (GX-1050, AVT) with a 1/3 inch sensor and a full well capacity of is used. In the experiment, we first collected 30 single-shot measurements at an exposure time of for two different input light power levels. A set of calibration data was computed from the average values using the two-point correction method. It is easy to calculate the theoretical value of the speckle contrast, which is , in a single frame. After averaging the multiple frames, the speckle contrast in the averaged data further deceases to . Due to the low speckle contrast, we only conducted the measurement to evaluate the non-uniformity of the whole field, rather than treating speckle and flatness as separate. To this end, we moved the detector transversely by 2 mm and collect another 30 frames. The change in the illuminance is very small, and the effect of the nonlinear response of the detector is negligible. We refer to Fig. 4, where it can be seen that the flatness variation does not exceed 0.1% rms within the interested domain. Figure 5 displays the non-uniformity of the averaged multiple measurements with our detector after calibration. A non-uniformity as low as 0.2% rms was obtained. The measured data at is in reasonable agreement with the theoretical value of the photon noise, which is computed by , where is the recorded signal intensity and the constant is used to normalize the photon noise of the photo-electrons to the units of bits of the analog to digital converter (ADC) output signal. A simple function was used to fit the data and for (, ) was calculated. The non-zero value of is caused by the residual photon noise in the reference data, which should be treated carefully when calibrating a detector with a low well capacity (e.g., less than electrons for the LTP application). For precision calibration, a highly stable light source and a number of measurements are necessary, even though some are difficult.
Figure 5.Measure of non-uniformity after averaging multiple measurements with the use of our detector.
In conclusion, we develop a general system based on light diffusion to generate a uniform light field for a reference-based NUC. The Monte Carlo method is used to perform a sensitive analysis of the transmittance/absorption with respect to the optical properties of the solution and the system structure parameters. In particular, we show that the performance of the system is subject to the reflectivity of the cavity and the transport mean free path in the solution. For example, we show the possibility of enhancing the transmittance by shortening the cavity length for a certain correlation time, which is different from the conclusion reached by Redding et al.[19]. It is important to note that proper characterization of the system configuration enhances the transmittance for a cavity with non-ideal reflectivity. In addition, our experiment shows that the detector with a high well capacity is more suitable for high-precision measurement applications, considering that the calibration precision is affected by photon noise. The efficiency and advantages of this diffusion system will be of great benefit in realizing a uniform illumination over a large field area in a convenient and robust way for many scientific and engineering applications. Despite the general usefulness of the system, there still remain several important questions that must be addressed in order to extend the range of its applications. For example, it suffers from an aggregation of nanoparticles, and is only useful within a short time period. The proper choice of nanoparticle size and the solution concentration incorporated in the diffuse-reflective cavity must be made in order to decrease the effect of aggregation. Further research efforts are also focused on fiber-coupling efficiency improvement, and the complete characterization of the flat field, such as the correlation time and the transmittance.
References
[1] V. V. Yashchuk. Proc. SPIE , 6317, 63170A(2006).
[2] D. Scribner, K. Sarkady, J. Caulfield, M. Kruer, G. Katz, C. Gridley. Proc. SPIE , 1308, 224(1990).
[10] J. L. Kirschman, E. E. Domning, K. D. Franck, S. C. Irick, A. A. McDowell, W. R. McKinney, G. Y. Morrison, B. V. Smith, T. Warwick, V. V. Yashchuk. Proc. SPIE , 6704, 670409(2007).
[11] T. Yandayan, R. D. Geckeler, F. Siewert. Proc. SPIE , 9206, 92060F(2014).
Fugui Yang, Qiushi Wang, Ming Li, "Light source system for high-precision flat-field correction and the calibration of an array detector," Chin. Opt. Lett. 13, 040402 (2015)