1Key Laboratory of Regional Sustainable Development Modeling, Institute of Geographic Sciences and Natural Resources Research, CAS, Beijing 100101, China
2College of Resources and Environment, University of Chinese Academy of Sciences, Beijing 100049, China
3Institute of Strategy Research of Guangdong-Hong Kong-Macao Greater Bay Area, Guangzhou 510070, China
Yannan ZHOU, Yu YANG, Zhouying SONG, Ze HE, Siyou XIA, Yawen REN. Dynamic transition mechanism analysis of the impact of energy development on urbanization in Central Asia[J]. Journal of Geographical Sciences, 2020, 30(11): 1825
Copy Citation Text
Energy development has a significant impact on urbanization. This study employs the entropy method to evaluate the level of urbanization in Central Asia and further analyzes the possible dynamic transition mechanisms of the impact of energy development (characterized by energy development scale, energy trade, energy consumption, and energy endowment) on urbanization using the Panel Smooth Transition Regression model (PSTR). The results demonstrate that energy development in this region is characterized by “three highs and one low”, namely, high production volume, high export volume, high endowment, and low self-consumption, and plays a crucial role in the progress of urbanization. A nonlinear relationship is found to exist between energy development and comprehensive urbanization in the transition economies of Central Asia. Generally speaking, as energy development continues to expand, its impact on urbanization in this region has shifted from constraint to promotion, with the latter gradually tending to flatten out. Energy development characterized by energy development scale, energy consumption, and energy trade can prove the point, whose threshold is 1.47 million tons oil equivalent (Mtoe), 0.29 tons oil equivalent (toe) per capita, and 20.95 Mtoe, respectively. However, not all energy development models exhibit this behavior. Energy development characterized by energy endowment is such a case where the positive effect of it on comprehensive urbanization will be restrained when it exceeds 3.18. These findings can aid decision makers in seeking a better energy development model to promote the sustainable development of urbanization in Central Asia, avoiding energy resources waste and disorderly development.
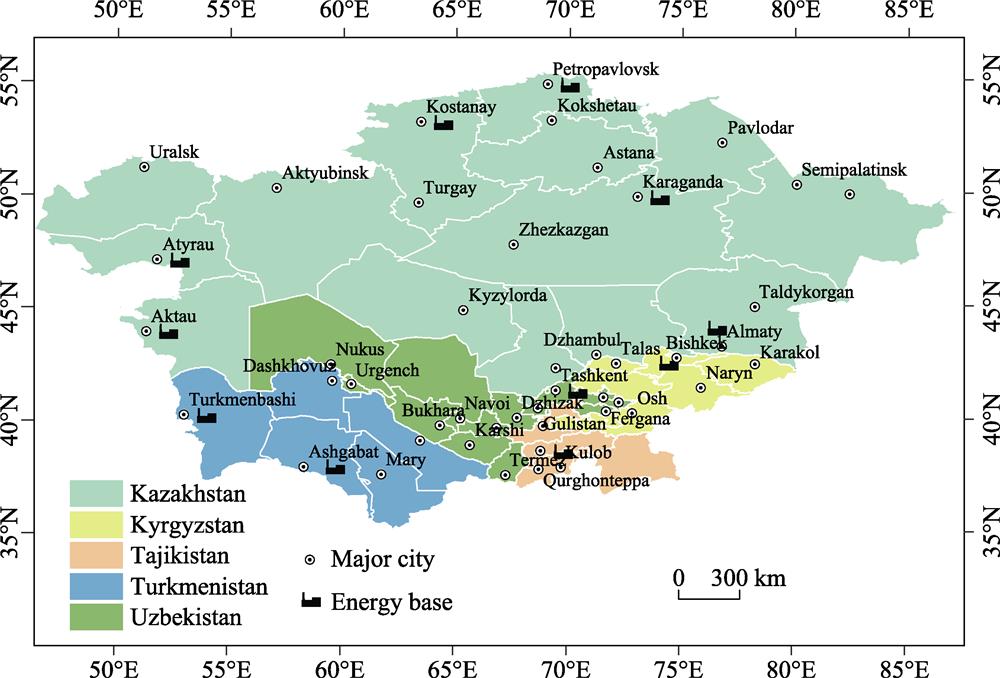
In the early 21st century, the Central Asian region (Figure 1) was characterized as being “largely ignored as a scholarly backwater of the defunct communist world system” (Luong, 2002). Now, however, with growing competition for the world’s energy resources and with long-term tensions in the energy market, the situation has changed, and the role of the Central Asian region in international affairs has increased considerably (Zabortseva, 2012). This energy-rich region has become an important component of a strategic game among energy-consuming countries (Kim and Indeo, 2013) and is therefore a region under close scrutiny by researchers in a number of fields (Roy, 2007; Rakhimov, 2010; Zabortseva, 2012; Tang et al., 2014). As a strategic hub for the construction of the Silk Road Economic Belt, an enrichment zone for strategic energy resources, and one of the key areas for superpower competition and political games (Fang et al., 2018), Central Asia is no longer a “forgotten region” but now one that is part of the “great game”. It is also a region where the energy costs of urbanization have been shown to be quite substantial (Hosier et al., 1993), and the impact of energy development in Central Asia plays an important role in its urbanization that cannot be ignored.
Energy must be considered not only as a production input, but also as one of the most important determinants of the economic, social, and geographic order of the world, shaping international economic and political relations in its role as a strategic commodity (Esen, 2016). As far as Central Asia is concerned, the way relying on resources endowments to increase energy development to drive economic growth and urbanization development has been proved to be an important path for the rise of Central Asian countries (Alexeev and Conrad, 2011; Zabortseva, 2012; Esen, 2016). For countries outside the region, including the United States, China, and the European Union, economic and trade cooperation and geo-infiltration (intentional or unintentional) with energy cooperation as a link (Dorian et al., 1999a; Yang et al., 2015) are becoming an important support for the strategic layout under the concept of global values (Zabortseva, 2012; Blank, 2019). Evidence for this is provided by the recent pattern of strategic staggered confrontation among foreign countries in Central Asia (Kim and Indeo, 2013; Blank, 2019; Zhao et al., 2019). The development of energy resources in Central Asia is important for the countries of the region to be able to achieve their goals of economic growth, integration into the global value division and participation in global governance. Consequently, the region’s abundant natural resources and the prospects for further development of its energy industries are of ever-growing significance.
During the Soviet period, the Central Asia’s urban framework was dominated by single-industry towns, which were focused on narrow objectives and specific tasks. The locations of cities and industrial sites were largely based on serving the needs of the agricultural economy and the formation of urbanized zones with significant extractive industries (ESCAP, 2013). After the disintegration of the Soviet Union, Central Asia entered a period of decline and reconstruction in which it was plagued by serious social and economic problems, such as population loss, decline of traditional industrial towns, collapse of public service systems, unemployment and lack of economic motivation, water shortages, and industrial pollution, mainly concentrated in urban areas (Yeerken et al., 2014). However, with the globalization of the economy, energy development in Central Asia has driven economic and social development in the region onto a road to recovery. The five Central Asian countries have carried out political and economic reforms to varying degrees, adopting measures to strengthen external economic connections and formulating ambitious plans for energy exploitation and export. For example, Kazakhstan implanted a zero-tariff policy to promote oil exports. Similarly, Tajikistan issued the “Republic of Tajikistan to 2015 Economic Development Plan” in 2004, with energy mining being taken as the focus of industrial development, as a result of which the energy exploitation industry’s share in gross industrial production increased from 9.38% in 2004 to 17.51% in 2016 (ADB, 2018).
Against a background of energy scarcity and an increasing worldwide division of labor, the Central Asia’s economy has maintained a relatively high growth rate by strengthening export-oriented development policies based on energy exploitation and raw material production (ADBI, 2016). After 2000, Central Asia completely rid itself of economic recession and achieved sustained and rapid economic growth. Its average annual growth rate of GDP1 was 7.07%. In 2016, its GDP reached 30.51 billion USD, an increase of 2.95 times compared with that in 2000 (WDI, 2019). It is no exaggeration to consider energy exploitation and export as the keys to achieving the rapid growth of Central Asia’s economy. This paper takes Kazakhstan, the fastest growing and biggest contributor among the Central Asian countries as an example. Its output from energy exploitation has reached 33.61 billion USD, accounting for 50.55% of its industrial output, of which crude oil exploitation accounted for 79.09% of the exploitation industry (MOFCOM, 2016). Its oil industry plays a critical role in Central Asia (Dorian et al., 1994), with most oil production being destined for export. Indeed, Kazakhstan’s export trade is becoming more and more dominated by fuel and energy products.
The development of energy resources in Central Asia has promoted energy towns as economic growth poles. With the establishment of Central Asia as a region for the exploitation of natural resources and energy, energy and raw material export and internationalization, resource-based towns, border trade ports, and international cities are bearing the functions of urbanization development. Cities such as the resource-based cities Aktau( The capital of the Mangystau Region in Kazakhstan, located on the eastern shore of the Caspian Sea.) and Atyrau(2 The capital of the Atyrau Region in Kazakhstan, located at the mouth of the Ural River on the Caspian Sea.) in the Caspian oil exploration areas and the trading and internationalizing integration cities of Tashkent(3 The capital and largest city of Uzbekistan, as well as its most populous city.) and Almaty(4 The largest city in Kazakhstan, as well as its major commercial and cultural center.), are developing rapidly and becoming the growth poles of their respective regions. Of which, Mangystau and Atyrau Regions in Kazakhstan produced the most oil, accounting for 65% of the national oil production and contributing 21% to the entire Kazakhstan economy, in 2008. At the same time, with their advantages as Caspian ports, the two cities of Aktau and Atyrau have developed rapidly and have become central to Caspian oil exploitation and as economic growth poles of western Kazakhstan. With a large concentration of logistic and capital flows, the population urbanization rate of the Mangystau Region during 2000-2006 was greater than 70%, second only to the Astanna Region (according to the Statistical Yearbook of the Republic of Kazakhstan).
Above all, as an essential factor for consumer goods and production, energy resources in Central Asia are affecting the progress in urbanization from multiple dimensions, such as production (Ma et al., 2010), trade, consumption, and endowment. Urbanization is also a multidimensional, dynamic, and complex process, whose development is closely related to economic foundations, industrial structure, social transformation, resources, and environment (Chen et al., 2019). The progress of urbanization as characterized by the population urbanization rate can reflect the state people moving from rural to urban(Ades and Glaeser, 1999) but cannot fully capture the evolution of its economic level and public service capacity (Wang et al., 2019; Wu et al., 2019), especially in Central Asia. In addition, energy development, through a variety of factors, can affect different modes of urbanization: economic, population, and social urbanization. We can analyze this process from two perspectives (Figure 2).
Figure 2.
Transmission mechanism from energy development to urbanization
At a micro level, the impact of energy development in Central Asia on urbanization is reflected in the improvement of urban labor productivity (Chen and Zhou, 2017) and the optimal allocation of resources, whose endogenous scale effects on production, investment, and consumption attract population to urban agglomerations (UNCTD, 2011; Turok and McGranahan, 2013). The progress in urbanization will increase the income of residents and thus provide the rural population with an economic incentive to move to urban areas with higher consumption (Cohen, 2006b). It will also enhance the consumption capacity of residents and help satisfy the material and cultural needs of society as a whole. Increases in demand have prompted governments to increase investment in public goods and public services, while mobilizing market forces to expand production to meet the demand for private consumer products. This extensive and concentrated demand provides conditions for enterprises to expand production and to scale operations, while attracting various elements to urban areas.
At a macro level, the impact of energy development in Central Asia on urbanization is reflected in the transformation and upgrading of the economic structure(Bertinelli and Black, 2004; Ge et al., 2005; Turok and McGranahan, 2013), population structure(Davis, 1965; Zhang, 2002; Han et al., 2018) and infrastructure (UNCTD, 2011; Chester et al., 2014; Maparu et al., 2017), promoting economic, population, and social urbanization. Economic growth accelerates the transformation of the demographic structure (Yang et al., 2019), guiding the continuous optimization and upgrading of effective demand, and promoting technological progress, which in turn increases the scale of industry and enhances the transformation of economic structure. At the same time, energy development promotes reform of both the mechanism and system of urbanization, by gradually removing various impediments to the progress of urbanization, as well as creating an overall environment that is more conducive to urbanization, by removing barriers to population migration and promoting changes to income distribution.
To date, there has been relatively little research on the nexus of energy development and urbanization in Central Asia. More attention has been paid to energy security (Cohen, 2006a; Dorian, 2006), energy development and cooperation (Dorian et al., 1999; Rakhimov, 2010; Yang et al., 2015; Fazilov and Chen, 2013; Haitao and Sun, 2018), energy trade (Tarr, 1994; Olcott, 2004; Yang et al., 2018), energy geopolitics (Roy, 2007; Petersen and Barysch, 2011; Cooley, 2012; Zabortseva, 2012; Kim and Indeo, 2013; Blank, 2019) , and other areas. The study of urbanization in Central Asia has generally focused on the period of the former Soviet Union (Atamirzaev et al., 1978; Buckley, 1998). Little attention has been paid to the evolution of urbanization in Central Asia in the 25 years after the breakup of the Soviet Union, whose economy underwent a huge transformation from centralization to a free market. Even where there have been studies of urbanization in Central Asia during the transition period, these have often been based on a single country (Yeerken et al., 2014). There exist both commonalities and differences in Central Asian urbanization development. In Central Asia, many regions, such as Kazakhstan, are thriving on their energy resources (Li et al., 2018), with the energy industry promoting the gradual recovery of the socio-economic system. However, this recovery is concentrated in just some urban areas, while traditional industrial towns are still in a state of decline (Yeerken et al., 2014). At the same time, with a decline in the scale of energy exploration, the urbanization of some cities in Central Asia has also begun to decline. For example, the Mangystau Region in Kazakhstan, an area that was once thriving on energy (Dahl and Kuralbayeva, 2001), is now in decline together with its energy resources. Since the oil fields in that region have been exploited for many years, it is difficult to stabilize and promote production. Meanwhile, there have been limits to new discoveries of oil fields, and these are yet to be put into production. At the same time, the region has also been affected by some unexpected events, such as the oil workers’ riots and strikes in the Ozen field( An oil field in Uzen, a city in the Mangystau Region of Kazakhstan.), with serious impacts on local energy development. Correspondingly, the local population urbanization rate has also fallen, from 57.62% in 2008 to 40.77% in 2018 (according to the Statistical Yearbook of the Republic of Kazakhstan). Thus, the impact of energy development on urbanization in Central Asia can no longer be underestimated. Owing to the large differences in resource endowments, geographical conditions, and human factors, urbanization varies depending on the energy development model adopted. Therefore, questions arise as to the roles of energy development in the progress of urbanization in different regions of Central Asia. Will the impact of different energy development models on urbanization be transformed? What kind of spatial heterogeneity is exhibited by this transformation?
Therefore, in this paper, we adopted the PSTR model to investigate the dynamic transition mechanism between energy development and urbanization during the period 1992-2016 in Central Asia, when it underwent a transition from a centrally planned economy to a free market economy following the collapse of the Soviet Union at the end of the 1980s.
2 Methods and data
2.1 Method for calculating comprehensive urbanization
First, we construct an indicator system for Central Asian comprehensive urbanization. The evaluation indicators for this urbanization process are shown in Table 1. These indices can be divided into three levels: target level, standard level, and index level.
Target level
Standard level
Index level
Definition
Unit
Comprehensive urbanization
Population urbanization
Urban population
Scale of people living in urban areas
Person
Urban population rate
Urban population as percentage of total population
%
Urban population growth
Growth rate of urban population
%
Economic urbanization
Industrial structure
Share of secondary and tertiary industry added value over total GDP
%
GDP per capita
Gross domestic product divided by population
Constant 2010 USD
GDP growth
Growth rate of GDP
%
Social urbanization
Transportation development
Energy consumption of transport
Mtoe
Employment structure
Percentage of population employed in secondary and tertiary industries
%
Technology level
Economic output (GDP) per energy consumption
Ten thousand 2010 USD per toe
Table 1.
Central Asia’s comprehensive urbanization indicator system
We then evaluate the comprehensive urbanization level of each country in Central Asia using the entropy method (Wu et al., 2019) to determine the index weight based on the degree of dispersion of each sample.
(1) Standardization: we standardized the data of nine positive indicators in the five countries of Central Asia during 1992-2016:
where Aij are the results of standardization of the indicators, aij is the value of the jth indicator in the ith year, and n and m are the numbers of samples and indicators, respectively.
where Pij is the proportion of Aij in the ith year to the jth indicator. Ej is the information entropy, the evaluating object i on the indicator j is excluded if Aij = 0.
where Dj is the redundancy of the entropy and Wj is the weight of the jth indicator.
(4) Comprehensive score of urbanization:
$Urban_{i}=\sum_{j=1}^{m}W_{j}P_{ij}$
2.2 PSTR model
The wide applicability of the panel threshold regression (PTR) model proposed by Hansen (1999) benefits from the changes in threshold variables over time, which enables individuals to be categorized into different groups and realizes transitions between different mechanisms. However, the discontinuity of the functions involved in the model implies that these transitions are instantaneous, which is a defect of the PTR model. In contrast, the PSTR model proposed by González et al. (2005) relaxes the assumption that the influence coefficients of the heterogeneous variables are discontinuous at the threshold points, thus allowing the transitions of the influence coefficients between different mechanisms to be gradual processes. The PTSR model is thus a generalization of the PTR model, which is a fixed model with exogenous explanatory variables.
The present study adopts the PSTR approach to demonstrate the transition mechanism between urbanization and energy development in Central Asia. A generalized multi-mechanism PSTR model can be written as follows:
where i and t are the individual and time dimensions of the cross section, respectively, yit and xit are the explained and explanatory variables, respectively, c is an m-dimensional vector of location parameters, ui and $\xi_{it}$ are the individual fixed effect and residuals, respectively, $g_{j}(q_{jit},\gamma,c)$ is a continuous and bounded transition function of the threshold variable qjit whose range of values is between 0 and 1, and γ is a slope parameter that determines the conversion speed of the transition function $g_{j}(q_{jit},\gamma,c)$, and$\beta_{0}+\sum_{j=1}^{r}\beta_{j}g_{j}(q_{jit},\gamma,c)$ is the regression coefficient. Generally, it is enough to consider the case m = 1 or m = 2 in the PSTR model.
Given that this paper mainly studies the impact of energy development on urbanization in Central Asia, we introduce only the related elements of energy development into the urbanization model and establish the following PSTR model of the urbanization and energy development in Central Asia:
where Urbanit denotes the explained variable evaluated by the comprehensive urbanization score in the ith country and tth year in Central Asia, and EDit represents energy development, which is both explanatory variable and a threshold variable. To simplify energy development and make it more specific, we study it from the viewpoint of energy development scale, energy trade, energy endowment, and energy consumption. Therefore, the formula (9) can be divided into four cases, in which the explained variable Urbanit varies with respect to (a) energy development scale, (b) energy trade, (c) energy consumption, and (d) energy endowment, respectively.
It is necessary to test for nonlinearity, remaining nonlinearity, and the number of thresholds before estimating with the PSTR method. The testing procedure works for nonlinearity and remaining nonlinearity as follows. First, test a linear model (r = 0) against a model with one threshold (r = 1). One of the most commonly used tests is the LMf statistics of autocorrelation test (González et al., 2005). If the null hypothesis (H0: r = 0) is rejected, this indicates that there exists a nonlinear relationship among variables, and further tests are needed to test for remaining nonlinearity, i.e., for whether there exists a unique transition function (H0: r = 1) or at least two transition functions (H1: r = 2). If the null hypothesis (H0: r = 1) is again rejected, then a further test for the existence of three or more transformation functions is performed. First, the null hypothesis H0: r = r* (r* > 3) and its alternative hypothesis H1: r* + 1 are tested. This procedure is continued to determine the number of transition functions until the hypothesis of no additional threshold is not rejected (Fouquau et al., 2008). The number of thresholds is further tested according to Akaike information criterion (AIC) and Bayesian information criterion (BIC). The model with the minimum AIC and BIC values is selected, since the smaller these values, the better is the fitting effect of the model.
2.3 Data
This study considers five country-level administrative units in Central Asia and investigates the impact of energy development on Central Asia’s urbanization. The socio-economic data used in this study come mainly from World Development Indicators (WDI, 2019) published by the World Bank, and the energy-related data are mainly from World Energy Balances published by the International Energy Agency (IEA, 2019). Given that the Central Asian countries only became independent after the dissolution of the Soviet Union in 1991 and that energy-related data from IEA has only been updated so far to 2016, we employ Central Asia’s energy-economy-society related data between 1992 and 2016.
Specifically, the explanatory and threshold variable ED is concerned in the PSTR model, the data on energy production, on the sum of total energy imports and exports, on energy production divided by total primary energy supply, and on total energy final consumption per capita from IEA are expressed as the energy development scale (ES), energy trade (ET), energy endowment (EE), and energy consumption (EC), respectively. These data are shown in Figure 3.
From the perspective of population urbanization rate (Figure 4a), the population urbanization rate in Central Asia varies significantly, and can be basically divided into three levels. The first level is Kazakhstan, whose population urbanization rate indicates a high degree but stagnant development. Its population urbanization rate was 57.26% in 2016, which is only 1.36 percentage points higher than it was in 1992. The second level comprises Uzbekistan and Turkmenistan, whose population urbanization rates are in the middle stage of development. These two countries do differ, however, in the trends of their population urbanization rates. In Uzbekistan, the rate rose continually to 51.15% during the period 1992-2011 and then began to decline, falling to 50.65% in 2016. For Turkmenistan, there was basically a continual rise, from 44.73% in 1992 to 50.73% in 2016. The third level comprises Kyrgyzstan and Tajikistan, whose population urbanization rates have stagnated at a low level. Both of their population urbanization rates fell sharply during the period 1992-1998, and remained basically stagnant afterward. Given the history of the Central Asian countries, their development and the evolution of their comprehensive urbanization (Figure 4) have been affected by the collapse of the Soviet Union, as well as by the variations in geographical conditions, energy endowments, human environments, and policy systems in these countries. Due to lack of consideration of these differences, however, the population urbanization rate does not seem to capture the progress of urbanization in Central Asia during the transition period. In contrast, the comprehensive urbanization level combined with data on population, economy, and society can better reflect the evolution of urbanization in Central Asian countries.
Figure 4.
Changes in population urbanization rate and comprehensive urbanization in Central Asia during 1992-2016
As shown in Figure 4, the comprehensive urbanization level in Central Asia is basically consistent with the population urbanization rate from the perspective of regional differences. The comprehensive urbanization level in Central Asia is still the highest in Kazakhstan, which is closely related to its fast-growing economy (Kazmaganbetova et al., 2016), followed by Uzbekistan, Turkmenistan, Kyrgyzstan, and Tajikistan. However, comparing the population urbanization rate with the level of comprehensive urbanization in Central Asian country itself, there are great differences in the trend of change between them. Such as Kazakhstan, its comprehensive urbanization has gone through two more obvious stages during the transition period. With the year 2000 as the turning point (Figure 4b), Kazakhstan’s comprehensive urbanization development began to pick up after a continuous decline, in line with the Kazakhstan urbanization process portrayed by Yeerken et al. (2014). The reason for this turn of events is that the collapse of the Soviet Union severely damaged the socio-economic balance in Kazakhstan and paralyzed the public service system, which was manifested in particular in urban areas. And the population, economic, and social urbanization subsystems before 2000 were damaged to varying degrees (Figure 5a). Especially with regard to the social and economic urbanization of Kazakhstan during the period 1992-1996, owing to the sudden changes in the political system, Russian skilled workers in a large number of towns were evacuated from Kazakhstan. Most factories were shut down, and energy production shrunk dramatically from 8.95 Mtoe in 1992 to 6.61 Mtoe in 2000 (IEA, 2019). The basic functions of urban housing, medical care, education, and social security stagnated, and urban development fell into in a serious setback phase that continued until 2000. Since then, the oil economy has become a leading industry, promoting Kazakhstan’s economic urbanization and new city development, and its per capita GDP increased from 4491 USD in 2000 to 10,583 USD in 2016. The contribution of the oil economy to growth is the main driving force for Kazakhstan’s urbanization after 2000. As can be seen from Figure 5a, Kazakhstan’s economic urbanization has rebounded strongly since 2000, and surpassed the level of population urbanization in 2004. The rise of the oil economy has increased the financial revenue in Kazakhstan, thereby increasing financial expenditure on education, health, social security, housing, etc., and promoting the process of social urbanization in Kazakhstan. At the same time, the oil industry has driven Kazakhstan’s production materials market and labor market, increased employment, and encouraged more of the rural population to move to urban areas, thus continuously improving the level of population urbanization.
Figure 5.
Evolution of three subsystems (population, economy, and society) of comprehensive urbanization in Central Asia during 1992-2016
In the other four regions of Central Asia, except for the continued growth of comprehensive urbanization in Uzbekistan, the evolution of urbanization witnessed a similar pattern that in Kazakhstan. The destruction of urban functions and the decline in some industrial towns caused by the disintegration of the Soviet Union were the main reasons for the continuous decrease in the comprehensive urbanization level in the early years of independence. There are differences, however, in the aspects in which the recession in urbanization is reflected. The recession in comprehensive urbanization in Tajikistan and Kyrgyzstan was mainly due to economic restructuring (declining industrial capacity, growing agricultural sector, and rising unemployment), which caused a sharp decline in economic urbanization and population urbanization. As can be seen from Figures 5d and 5e, owing to the recovery and stabilization of the economy, both social urbanization and economic urbanization led to a rise in the level of comprehensive urbanization (Figure 4b). However, Turkmenistan is different. Owing to its uneven and fragmented population distribution, Turkmenistan’s population urbanization was at a low but continuously rising level (Figure 5c). Its initial recession in urbanization was concentrated in the economic and social aspects, mainly as a result of the blockage of export channels and a sharp decline in output following the collapse of the Soviet Union. Uzbekistan is the most populous of the countries of Central Asia, although the sudden change of political system in the early stage of transition hampered its urbanization development. In particular, economic urbanization declined in the early years. However, as comprehensive urbanization came to be greatly affected by population urbanization, Uzbekistan’s urbanization development continued to grow.
3.2 Energy development in Central Asia
Energy development in Central Asia can be characterized by “three highs and one low”: high production volume, high export volume, high endowment, and low self-consumption. The energy resources of Central Asia are unevenly distributed, and energy development varies.
From the perspective of energy production, following the disintegration of the Soviet Union, energy production in Central Asia fell sharply in the early transition period, from 182.60 Mtoe in 1992 to 139.86 Mtoe in 1998. After that, it began to increase. By 2000, Central Asian energy production had risen to 182.29 Mtoe. This was mainly due to the substantial increase in energy production caused by the intense exploitation of Uzbekistan crude oil during this period (Figure 6a). The other four countries in Central Asia were hit hard by the disintegration of the Soviet Union, and energy production had not been recovered. For example, coal in Kazakhstan, Kyrgyzstan, and Tajikistan, and natural gas in Turkmenistan, were in a state of reduced production in that period. With the improvement of the economic situation, energy production in Central Asia began to increase as a whole from 2000. Taking Kazakhstan as an example, oil and gas production began to increase substantially from 43.73 Mtoe in 2000 to 116.36 Mtoe in 2016. Accordingly, its urbanization index also increased significantly from 13.28 to 22.48. In 2016, Central Asian energy production was 294.60 Mtoe, strongly concentrated in Kazakhstan (55.22%). From the perspective of energy production structure and geographical distribution, Central Asia produces a large amount of coal, oil, and gas. Of which crude oil and coal production are mainly concentrated in Kazakhstan, accounting for 84.61% and 94.12%( It indicates the percentage of one energy type produced in one country accounting for the total of that produced in Central Asia, the same below in this paragraph.) of those produced in Central Asia, respectively; while natural gas production is mainly concentrated in Turkmenistan and Uzbekistan (these two accounting for 75.95%), with some in Kazakhstan (24.03%). And hydropower production is mainly concentrated in Tajikistan (32.25%).
Figure 6.
Energy development during 1992-2016 in Central Asia
From the perspective of energy trade, the low degree of industrialization in Central Asia, coupled with the small self-consumption of energy products, has led to the bulk of energy being exported, most of which in the form of crude oil, natural gas, and coal, accounting for about 80% of Central Asia’s energy exports. In 2016, the export volumes of crude oil, natural gas, and coal in Central Asia reached 65.00 Mtoe, 69.13 Mtoe, and 11.45 Mtoe, respectively, accounting for 67.64%, 47.38%, and 23.83% of the corresponding production. The energy products are imported and exported differ among the five countries. For example, Kazakhstan, which boasts abundant energy resources and is the largest energy exporter in Central Asia, mainly exports coal and crude oil. It is followed in second and third place by Turkmenistan and Uzbekistan, which mainly export natural gas. Tajikistan and Kyrgyzstan are low in energy endowments, and their energy trade is dominated by imports.
The energy endowments vary considerably among Central Asian countries. Turkmenistan, Kazakhstan, and Uzbekistan’s energy endowments are relatively high, and the values of their energy self-sufficiency are basically greater than 1. There have been relatively large fluctuations in Turkmenistan’s energy endowment, with its energy self-sufficiency falling from 5.47 to 1.45 in the early stage of the transition period and subsequently rising again during 1999-2016. Kazakhstan’s energy self-sufficiency showed a generally rising trend, from 1.13 in 1992 to 1.94 in 2016. Uzbekistan’s energy self-sufficiency changed relatively little, rising from 0.90 in 1992 to 1.36 in 2016. Owing to geographical conditions, Tajikistan’s and Kyrgyzstan’s energy endowments are not as high as those of the other three countries, and both of their energy self-sufficiency levels are below 1 in 2016.
The absolute amounts of energy consumption in the Central Asian countries are small, but there are relatively large spatial differences in energy consumption. Specifically, the energy consumption in Kazakhstan is the highest in Central Asia, followed by Uzbekistan and Turkmenistan, with respective values in 2016 of 37.66 Mtoe, 26.81 Mtoe, and 17.96 Mtoe, which account for just 23.15%, 52.59%, and 23.31% of each country’s energy production. The corresponding per capita energy consumption of the three countries were 2.12 toe, 0.84 toe, and 3.07 toe, respectively. The trends of per capita energy consumption of the three countries were different during the study period. The per capita energy consumption in Kazakhstan showed relatively large fluctuation. After decreasing enormously from approximately 4.00 toe per capita in 1992 to 1.47 toe per capita in 2002, its per capita energy consumption rose significantly back to 2.71 toe per capita in 2008 before fluctuating downward to 2.12 toe per capita in 2016. However, a steady increase can be found in Turkmenistan. The reverse is the case when it comes to that in Uzbekistan, whose figure fell continuously from 1.50 toe per capita in 1992 to 0.84 toe per capita in 2016.
3.3 Impact of energy development on urbanization
From the above analysis of urbanization and energy development in Central Asia during 1992-2016, it appears that these two processes are inextricably linked. Therefore, we apply the PSTR model to further explore the dynamic impact of energy development in Central Asia on urbanization and the dynamic relationship between them.
To determine whether there is a nonlinear relationship between energy development and urbanization, LMf test statistics are applied to test the linearity and remaining nonlinearity of the model. The results are shown in Table 2. From the results of the linearity test, the LMf statistics in all the models reject the null hypothesis (H0: r = 0) at a significance level of 5%. This shows that there exists an obvious heterogeneity between energy development and urbanization in Central Asia. This further confirms the accuracy of the estimation using PSTR. The remaining nonlinearity test results show that the energy development scale model (m = 1 and m = 2), the energy consumption model (m = 2), and the energy endowment model (m = 2) cannot reject the null hypothesis (H0: r = 1) at a 5% significance level, i.e., there is only one transformation function in these models. However, the results indicate that there are two transition functions in the remaining models. According to the AIC and BIC, the optimal location parameter m in all of these models can be determined to be 1.
ModelNumber of location parameters
Energy development scale
Energy trade
Energy consumption
Energy endowment
m = 1
m = 2
m = 1
m = 2
m = 1
m = 2
m = 1
m = 2
H0: r = 0 vs H1: r = 1
11.75
7.43
35.37
20.79
12.07
5.98
15.87
11.46
(0.00)
(0.00)
(0.00)
(0.00)
(0.00)
(0.00)
(0.00)
(0.00)
H0: r = 1 vs H1: r = 2
0.03
1.92
6.35
3.89
1.20
9.93
11.22
0.00
(0.85)
(0.15)
(0.01)
(0.02)
(0.27)
(0.00)
(0.00)
(0.99)
H0: r = 2 vs H1: r = 3
—
—
0.02
0.44
—
0.01
0.63
—
—
—
(0.88)
(0.64)
—
(0.99)
(0.43)
—
AIC
-3.02
-2.98
-2.83
-2.63
-2.53
-2.35
-2.83
-2.43
Schwarz
-2.93
-2.87
-2.66
-2.43
-2.44
-2.43
-2.67
-2.32
Table 2.
LMf tests for determining the remaining nonlinearity of the number of location parameters
In this paper, selection of the optimal values of γ and c is accomplished by the grid search method. Then, Nonlinear Least Squares (NLS) method is applied to estimate the remaining parameters of the model. The estimated results are shown in Table 3.
To further investigate the impact of energy development on urbanization in Central Asia, we calculate the averages of the energy development scale, energy trade, energy consumption, and energy endowment for the five Central Asian countries from 1992 to 2016. Combined with the parameter estimates of the threshold variables in the PSTR model, the values of the corresponding relationship coefficients are calculated. On this basis, we show plots of the relationships between energy development and urbanization in the five Central Asian countries in Figure 7. Among the four subsystems of energy development, there are significant differences in their impact on urbanization of the Central Asia countries. The continuous development of energy in Central Asia leads to a promotion of urbanization, which then gradually tends to flatten out. The specific conversion mechanism for the impact of energy development on urbanization can be described as follows.
Figure 7.
Estimated relationship coefficients between energy development and urbanization in Central Asia
As the energy development scale continues to expand, the impact of energy development on urbanization in Central Asia shifts from constraint to promotion (Figure 7a). The value of the threshold variable ES (the energy development scale) in Table 3 is 1.47 (e0.39). The value of β0 < 0 indicates that the progress of urbanization is limited to a certain extent when the energy development scale is less than 1.47 Mtoe, while the value of β1 > 0 indicates that Central Asia urbanization continues to increase with expanding energy development scale when the latter exceeds 1.47 Mtoe. In addition, γ = 4047.80, showing that the model transition speed is very fast, approaching that of the simple PTR two-zone model. In summary, within a certain range, the energy development scale restricts the progress of urbanization, but beyond this range, this constraint will be weakened, and thus the progress of urbanization will be promoted. The reasons for this phenomenon can be explained as follows.
Although Central Asia is an energy-abundant region, its distribution of energy is extremely uneven. For example, in Kyrgyzstan and Tajikistan, there is a serious shortage of resources, and their energy consumption mainly depends on imports (Figure 6b). The energy scarcity and limited energy supply constrain the progress of urbanization in these countries. In recent years, Kazakhstan, Turkmenistan, and Uzbekistan have relied on energy production and relatively complete industrial systems to support rapid development of their economies and urbanization. The average value of the energy development scale in these three countries is above 3.50 Mtoe, so the overall scale of energy development is a catalyst for their urbanization. However, the energy development for Tajikistan and Kyrgyzstan is not. Faced with an energy crisis and restrictions imposed by geographical conditions and energy resources, the development of these two countries is hindered. The development of hydropower resources should be the best route for them to follow. Tajikistan is a good case. In 2016, Tajikistan’s hydroelectric energy production ranked first in Central Asia, reaching 1.43 Mtoe, accounting for 69.52% of its energy production and 32.25% of Central Asian hydropower production (Figure 6a). The vigorous and continuing development of hydropower resources has enabled Tajikistan’s energy development to aid the progress of urbanization (Figure 7a). In contrast, Kyrgyzstan currently has low energy development (Figure 6a) and this is still a constraint on the progress of urbanization, although it is steadily weakening (Figure 7a).
3.3.2 Energy trade
Today, with the development of economic globalization and trade liberalization, urbanization as one of the most important economic and social phenomena has become an irreversible trend. Energy trade has also been an important engine for driving the economy in Central Asia (Aydın et al., 2017). Owing to the wide geographical distribution of energy and the spatial separation of energy supply and demand, Central Asia has made the energy trade an important part of both its internal and external trade. Through energy trade, Central Asia participates in international energy circulation and reproduction, with a non-negligible influence on the progress of urbanization. Given the difference in energy reserves among the different Central Asian countries, there are also great differences in energy trade among them. With the continuous expansion of energy trade, the constraints imposed by energy trade on urbanization in Central Asia have gradually weakened. When the volume of energy trade reaches a certain value, it begins to have a promoting effect on the progress of urbanization in Central Asia. Specifically, from Table 3 and Figure 7b, it can be seen that when the energy trade volume is lower than 2.17 Mtoe (e0.77), energy trade imposes a strong constraint on urbanization. However, when energy trade volume exceeds 2.17 Mtoe, this constraint will be rapidly eased. As the volume of energy trade further expands to 20.95 Mtoe (e3.04), the impact of energy trade on regional urbanization is gradually transformed into a facilitating role. The transition in the latter phase is more gradual than that in the former (
). The reasons for these phenomena can be summarized as follows.
The energy trade in Central Asia is over-dependent on Russia, resulting in a failure to maximize the benefits of energy export. Taking Turkmenistan and Uzbekistan as examples, these countries, which are the two major energy exporters in Central Asia, mainly export natural gas, which is the dominant energy source in Central Asia but mainly exported to Russia. The simplification of energy exports means that the energy trade of Turkmenistan and Uzbekistan has not had a positive effect on the progress of urbanization. However, as can be seen from the trend in Figure 7, as the volumes of the energy trade of these two countries continue to expand, the progress of urbanization will be gradually promoted. Kazakhstan, where the energy trade has a positive effect on urbanization, proves this point. Thanks to the unique energy advantages of the owner, and with its powerful economic strength, this country will vigorously develop its infrastructure and thus create better conditions for energy trade (ADBI, 2016), thus further promoting the progress of urbanization. As less-developed countries in the energy trade, Tajikistan and Kyrgyzstan, are highly reliant on the import of energy. Tajikistan has continuously reduced its energy imports with the development of hydropower, but Kyrgyzstan’s energy imports are still rising. In 2016, Tajikistan’s external dependence on energy was 34.06%, while that of Kyrgyzstan reached 58.84%. Their relatively backward economic development and imperfect energy infrastructure have made these two countries unable to compete effectively in the energy trade, and they depend heavy on imports of oil and gas from Russia, Kazakhstan, and Uzbekistan. Thus, energy trade is undoubtedly a constraint on the urbanization of Tajikistan and Kyrgyzstan.
3.3.3 Energy consumption
It can be seen from Figure 7c that as the per capita energy consumption in Central Asia increases, the constraints that it imposes on urbanization are gradually weakened. When the per capita energy consumption reaches a certain level, its effect changes, and it promotes the progress of urbanization. According to the parameters of the energy consumption model in Table 3, the threshold of energy consumption is 0.29 (e-1.24) toe/per capita. The value of β0 < 0 indicates that low energy consumption does not promote the progress of urbanization, but rather constrains it when energy consumption per capita is lower than 0.29 toe, while β1 > 0 indicates that urbanization is promoted by continuous consumption of energy when the per capita energy consumption exceeds 0.29 toe/per capita.
Rapid urbanization requires large-scale energy consumption (Cole and Neumayer, 2004; York, 2007; Poumanyvong and Kaneko, 2010; Zhang and Lin, 2012; Bai et al., 2014; Braun et al., 2014; Wang et al., 2014). It is difficult to support the progress of urbanization with low energy consumption. Tajikistan and Kyrgyzstan are the cases illustrating this. Furthermore, according to Figures 7b and 7c, the current promoting effect of energy consumption on urbanization in Central Asia is higher than that of energy trade. This is not difficult to understand. Central Asia, a major emerging energy player in the 21st century (Dorian, 2006), is abundant in coal, oil, and natural gas reserves. However, such energy potential is viewed simply as a resource that contributes only to export potential (Aydın et al., 2017). When resources obtained from the energy industry can be channeled into the productive activities and investment required for economic development and for urbanization, and production can be moved to industries with high added value that require advanced technology, then energy demand will increase in these countries with growing economies and increasing degrees of urbanization.
3.3.4 Energy endowment
It can be seen from Figure 7d that the impact of Central Asian energy endowment on urbanization has two thresholds of 0.66 and 3.18. When the energy endowment is less than 0.66, the progress of urbanization is constrained, but when the endowment exceeds 0.66, this constraint quickly disappears, and the energy endowment then promotes the progress of urbanization. However, if the energy endowment exceeds 3.18, it will again slow down the positive effect of energy endowment on urbanization: the so-called “resource curse”. According to Figure 7d, the impact of energy endowment on urbanization in Central Asia can be divided into three effects. First, there is the “energy tail effect” represented by Kyrgyzstan and Tajikistan, whose low energy endowments restrict the progress of urbanization. Second, there is the energy-promoting effect, represented by Uzbekistan and Kazakhstan, with relatively high energy endowments. Because their energy development is squeezed, the comparative advantage of energy endowment is still relatively prominent. Coupled with the lack of corresponding energy development technologies, talent, and funds, there is still a lot of room for energy endowment to promote urbanization. The third effect is the resource curse, represented by Turkmenistan, with the highest energy endowment in Central Asia. The relative excess of energy has an “energy curse” effect on the progress of urbanization. Since the disintegration of the Soviet Union, its oil and gas export channels have been limited, and production has fallen sharply (Effimoff and Engineering, 2000). In the early days of independence, the energy endowment fell from 5.47 in 1993 to 1.45 in 1998, and then began to rise (Figure 6c). During the period 2001-2005, the energy endowment of Turkmenistan exceeded the second threshold value (3.18). Excessive energy endowment no longer promoted the progress of urbanization, but weakened its positive effect on urbanization.
3.4 Limitation
Based on the above analysis, we investigated possible dynamic transition mechanisms of the impact of energy development with the PSTR model. The data we used were from reliable sources and the method is widely used in the research area. However, there are some limitations, which could be future research directions. One is about energy development evaluation system. We used the indicators of energy development scale, energy trade, energy consumption, and energy endowment to reflect the level of energy development in Central Asia. While some other indicators such as the efficiency, intensity and technology innovation investment of energy development are also valuable to measure energy development. Owing to the availability of some energy data in Central Asia, the evaluation system of energy development is not perfect at present. Therefore, it will be the focus of our follow-up research on Central Asia. The other is about the spatial scale of energy development in Central Asia. Energy base, the energy development carrier, is not only the main battlefield for large energy companies, but also a key area of local economic growth, and as well a strategic fulcrum for national energy security (Yang et al., 2020). Further research about the impact of energy development in Central Asia’s energy base on local urbanization will help optimize energy development layout, rationally allocate resources, and achieve local high-quality urbanization.
4 Conclusions and implications
In this study, we have employed the entropy method to construct a system for evaluating comprehensive urbanization in Central Asia. The PSTR model is further used to analyze the impact of energy development on urbanization in Central Asia. It is found that the level of comprehensive urbanization is the highest in Kazakhstan, followed by Uzbekistan, Turkmenistan, Kyrgyzstan, and Tajikistan. Furthermore, in addition to being affected by the disintegration of the Soviet Union, comprehensive urbanization is also influenced by energy development, whose energy development in the region can be characterized by “three highs and one low”: high production volume, high export volume, high endowment, and low self-consumption. And the level of energy development varies owing to the unevenly distributed energy resources in Central Asia. The results of PSTR model show that a nonlinear relationship exists between energy development and comprehensive urbanization in the transition economies, and further reveals that as energy development continues to expand, its impact on urbanization in Central Asia has shifted from constraint to promotion and that this promotion will gradually tend to weaken. Energy development characterized by energy development scale, energy consumption, and energy trade can prove that point, whose threshold is 1.47 Mtoe, 0.29 toe per capita, and 20.95 Mtoe, respectively. However, not all energy development models show this trend. Energy development characterized by energy endowment is such a case: although increasing energy endowment initially has a positive effect on comprehensive urbanization, this effect will reduce gradually when energy endowment exceeds 3.18. Based on the basic estimation results, we can derive several relevant policy implications as follows, which provide references for policy-makers in seeking a better energy development model to promote the sustainable development of urbanization.
First, Central Asia should strengthen energy infrastructure construction to expand the scale of energy development. The study found that Central Asia’s abundant energy reserves and endowments do not match the scale of Central Asia’s energy development. Central Asia is rich in energy resources and is the second-largest oil and gas production base in the world after the Middle East. The Central Asian countries, located in the hinterland of Eurasia, have to rely on large-scale transportation infrastructure for the communication with the outside world. However, the transportation facilities are still relatively undeveloped in parts of the region. Therefore, it should use its own endowment resources to attract foreign capital and technology, and thus promote its domestic infrastructure construction and exploration of energy resources, so as to achieve sustainable development of energy development.
Second, this study reveals that urbanization in Central Asian countries is restrained by energy trade as a whole except for Kazakhstan. It further indicates that there is still a lot of room for further promotion of urbanization and breaking the “Growth drag” of energy development by energy trade in Central Asia. However, it is not enough by simply enlarging the volume of energy trade for the simplification of Central Asia’s energy trade products and export direction. At present, Central Asia’s energy products are mainly dominated by large-scale export of oil and natural gas and exported to Russia, the European Union and the United States. In order to maximize the benefits of Central Asia’s energy trade, Central Asian countries should rely on other rich energy advantages, continue to research and develop new energy products, strengthen the technological level of energy products, and realize the diversification of energy product exports. Furthermore, Central Asia should strengthen energy trade cooperation with neighboring countries, especially China. As the initiator of the Belt and Road Initiative and the world’s second-largest economy, not only has China increasingly become a stabilizer and accelerator of the world economy, but also gradually become the core and new engine of the pan-Asian geo-economics. In recent years, China’s demand for energy resources has been increasing, and urgently needs a stable energy supply source to ensure its energy security. Central Asia can seize this opportunity to strengthen trade cooperation with China, and thus promote its development of economy and urbanization. At the same time, deepening the energy trade cooperation with China will also further strengthen Central Asia’s infrastructure construction given that China has rich experience to assist infrastructure construction. In addition, we found that the role of energy consumption in promoting urbanization in Central Asia turns out to be more important than that of energy trade. Thus, Central Asia should also expand domestic demand to increase consumption, thereby promoting the progress of urbanization.
Last but not least, studies of the dynamic transitions of the impact of energy development on urbanization will allow the creation of a better energy development model that coordinates spatial imbalance of energy production, trade, consumption, and endowment, to promote the sustainable progress of urbanization and provide references for other regions similar to Central Asia that have high energy endowments but poor urbanization development on how to avoid the “resource curse effect” caused by a surplus of energy resources. However, it is also noteworthy that although Central Asia’s energy endowment is relatively high, there are regional differences. The impact of energy development pattern on the progress of urbanization in countries such as Tajikistan, Kyrgyzstan can provide a reference for the countries that struggle with the “resource tail effect” caused by a lack of energy resources in the energy development process.
References
[1] AdesA F, GlaeserE L. Evidence on growth, increasing returns, and the extent of the market. The Quarterly Journal of Economics, 114, 1025-1045(1999).
[2] AlexeevM, ConradR. The natural resource curse and economic transition. Economic Systems, 35, 445-461(2011).
[3] Key Indicators for Asia and the Pacific 2018. Mandaluyong:. Asian Development Bank(2018).
[4] . Connecting Central Asia with Economic Centers(2014).
[6] Ayd?nC, Esen?. Does too much energy consumption harm economic growth for Turkish Republics in the transition process? New evidence on threshold effects. International Journal of Energy Economics Policy, 7, 34-43(2017).
[26] Esen?. Security of the energy supply in Turkey: Prospects, challenges and opportunities. International Journal of Energy Economics and Policy, 6, 281-289(2016).
[27] FangC L, MaoH Y, BaoC et al. Risk and prevention suggestions of China’s energy security in energy cooperation development with Central Asia in Silk Road Economic Belt. Bulletin of Chinese Academy of Sciences, 33, 554-562(2018).
[28] FazilovF, ChenX. China and Central Asia: A significant new energy nexus. The European Financial Review, 4, 38-43(2013).
[30] GeY, YaoS, PuY et al. Application of spatial autocorrelation for the spatial patterns of urbanization and localization economy. Human Geography, 20, 21-25(2005).
[31] GonzálezA, Ter?svirtaT, vanDijk D et al. Panel Smooth Transition Regression Models. Working Paper Series in Economics and Finance 604, Stockholm School of Economics. August(2005).
[32] MaH T, Sun, Z. Protection level and risk prevention of oil resources development in Central Asia for China. Bulletin of Chinese Academy of Sciences, 33, 594-600(2018).
[36] KazmaganbetovaM, SuleimenovB, AyashevK et al. Sectoral structure and energy use in Kazakhstan’s regions. 4th IET Clean Energy and. Technology Conference(2016).
[39] LuongP J. Institutional Change and Political Continuity in Post-Soviet Central Asia: Power, Perceptions, and Pacts. Cambridge: Cambridge University Press(2002).
[41] MaparuT S, MazumderT N. Transport infrastructure, economic development and urbanization in India (1990-2011): Is there any causal relationship?. Transportation Research Part A: Policy and Practice, 100, 319-336(2017).
[57] YangQ Z, MaP P, LvS J. Research on development efficiency of national energy base based on DDF-DEA Three-stage Model: Take 20 large comprehensive energy bases divided by the state as an example. Journal of Industrial Technological Economics, 39, 143-153(2020).
[58] YangY, HeZ, LiuY. Global energy cooperation between China and Central Asia: Current situation, risks, and countermeasures. Bulletin of Chinese Academy of Sciences, 33, 575-584(2018).
[60] YangY, LiuY, JinF J. Study on energy cooperation between China and the Central Asia and Russia under the view of energy geopolitics. Geographical Research, 34, 213-224(2015).
Yannan ZHOU, Yu YANG, Zhouying SONG, Ze HE, Siyou XIA, Yawen REN. Dynamic transition mechanism analysis of the impact of energy development on urbanization in Central Asia[J]. Journal of Geographical Sciences, 2020, 30(11): 1825