
Jhen-Si Chen, Jia Jia, Daping Chu. Minimizing the effects of unmodulated light and uneven intensity profile on the holographic images reconstructed by pixelated spatial light modulators[J]. Chinese Optics Letters, 2017, 15(10): 100901
- Chinese Optics Letters
- Vol. 15, Issue 10, 100901 (2017)
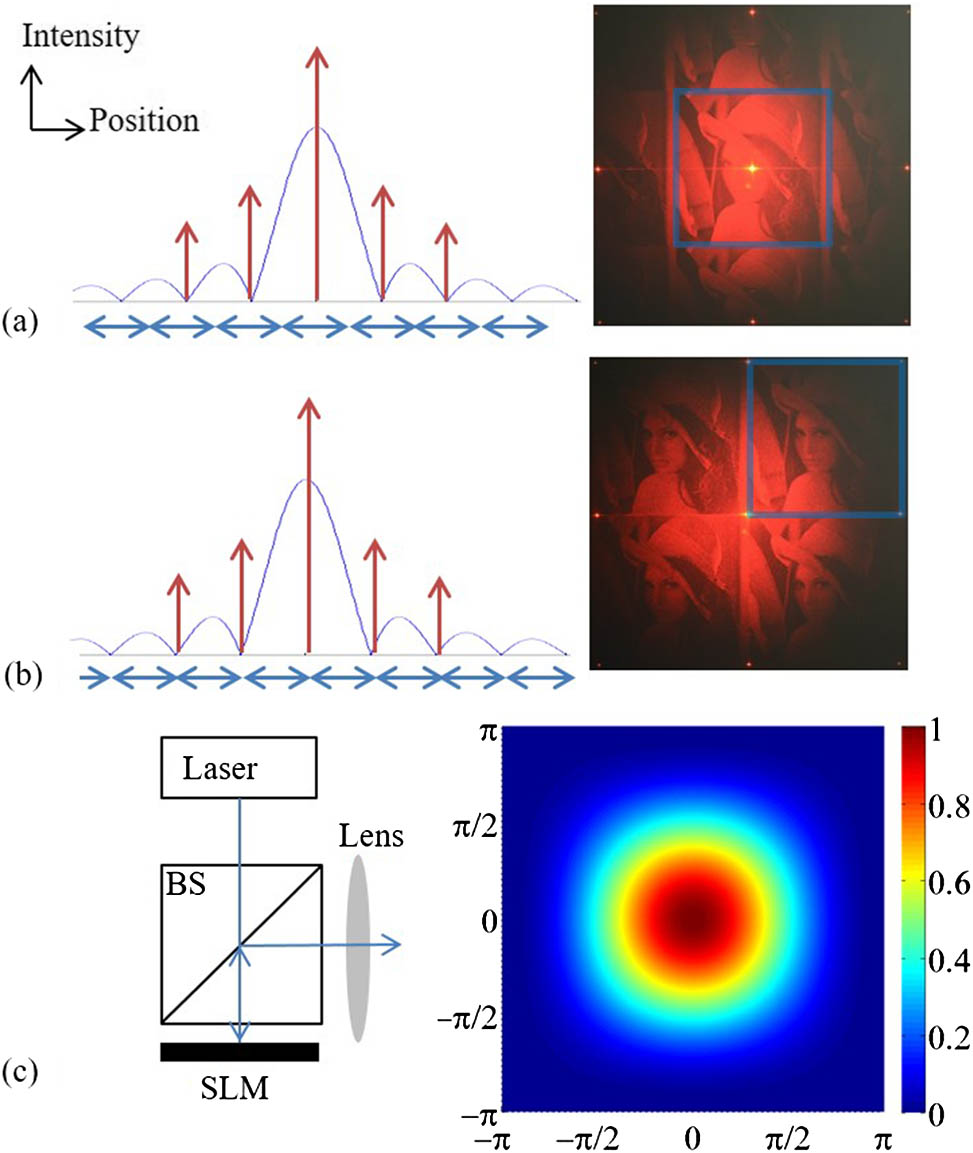
Fig. 1. (Color online) (a) On the left is the illustration of the intensity profile, in which the blue curve is the uneven intensity profile caused by the pixelation effect, red arrows are the bright spots from unmodulated light (the central bar is exceptionally longer because of both types of unmodulated light), blue arrows represent the repetitive reconstructed images. Note that this intensity profile is the 1D cross section parallel to the reconstruction and crossing the zero order. The Y axis is the intensity, and the X axis is the position. On the right is the physical reconstruction result of the Lenna; (b) similar to (a), but the image content is shifted, so the reconstructed images are located between two diffraction orders of bright spots; (c) the optical setup of a Fourier hologram reconstruction from an SLM, and the intensity distribution profile of 2D sinc function. The X axis and Y axis denote the positions in the intensity distribution profile of the 2D sinc function. The scale bar takes the maximum intensity as 1.0, and the rest is the relative values.
![(Color online) (a) Optics setup illustration. Two laser beams, split from the same beam by a beam splitter (BS), are colored with red dashed lines and blue straight lines. The 1D cross section intensity profile is also illustrated underneath; (b) left, the matching of two 1D cross section intensity profiles; right, the intensity profile after overlapping two profiles, while the black arrows mean the bright spots; (c) left, the intensity 2D distribution of the image region; right, the physical reconstructed Lenna image with the outline square box corresponding to the area of the intensity distribution on the left. The reconstruction applies multiple frames with random phase to reduce the speckle noise[13].](/richHtml/col/2017/15/10/100901/img_002.jpg)
Fig. 2. (Color online) (a) Optics setup illustration. Two laser beams, split from the same beam by a beam splitter (BS), are colored with red dashed lines and blue straight lines. The 1D cross section intensity profile is also illustrated underneath; (b) left, the matching of two 1D cross section intensity profiles; right, the intensity profile after overlapping two profiles, while the black arrows mean the bright spots; (c) left, the intensity 2D distribution of the image region; right, the physical reconstructed Lenna image with the outline square box corresponding to the area of the intensity distribution on the left. The reconstruction applies multiple frames with random phase to reduce the speckle noise[13].
Fig. 3. (Color online) (a) Shows the effective illumination light interference from two plane waves onto the SLM with the fringe size equal to pixel pitch; (b) shows the 1D cross section of the interference pattern intensity and the pixel structure; (c) shows that some dead area shines almost without illumination (dotted grey), some dead area with illumination (red stripes), and active area with the most illumination (plain blue).
Fig. 4. Illustration of the optics setup for four reconstruction image overlapping. Note that only two beams are drawn, since it is a cross section illustration. There are four beams on the

Set citation alerts for the article
Please enter your email address
© Copyright 2018-2021 | Chinese Laser Press. All Rights Reserved 沪ICP备15018463号-20