Jhen-Si Chen, Jia Jia, Daping Chu. Minimizing the effects of unmodulated light and uneven intensity profile on the holographic images reconstructed by pixelated spatial light modulators[J]. Chinese Optics Letters, 2017, 15(10): 100901
Copy Citation Text
A simple and effective approach is proposed to minimize the effect of unmodulated light and uneven intensity caused by the pixelated structure of the spatial light modulator in a holographic display. A more uniform image is produced by purposely shifting the holographic images of multiple reconstructed lights with different incident angles from the zero-diffraction-order and overlapping those selected different orders. The simulation and optical experimental results show that the influence of the zero-diffraction-order can be reduced, while keeping the good uniformity of the target images by this new approach.
Reconstructing 2D images from a pixelated spatial light modulator (SLM), which can be a liquid crystal display (LCD), a liquid crystal on silicon (LCoS) device, or a digital micro-mirror device (DMD), has been widely used to project holographic (2D) images[1–3]. However, the non-ideal device features cause the degradation of the quality of the reconstructed images. Two common problems are unmodulated light and the pixelation effect.
The unmodulated light comes mainly from two sources: (1) light reflected from the surface glass and large size (larger than light wavelength) pixels; (2) light reflected from or passing through (depending on reflective or transmissive SLMs) the dead area between pixels. Both of them contribute to the noises in the reconstructed images.
The type 1 unmodulated light usually generates a bright spot on the reconstruction plane for a Fourier hologram or a bright background on the reconstruction plane for a Fresnel hologram. It can be reduced significantly by using an anti-reflection (AR) layer on the glass surface[4]. However, it is not only expensive, but also difficult to remove glass reflection completely, especially for a range of wavelengths and different incident angles. A commercial AR coating layer can reduce the reflection at a given angle up to 0.5%[5,6], which still produces a bright enough spot after lens focusing in the Fourier hologram reconstruction. Note that the intensity magnification after a lens from a plane wave to a single point is large, considering the ratio of the sizes between the SLM panel and the focus point.
Sign up for Chinese Optics Letters TOC. Get the latest issue of Chinese Optics Letters delivered right to you!Sign up now
The type 2 unmodulated light caused by the dead area can be minimized by the existing manufacture technology with a fill factor of above 90% for the pixel pitch of 5–10 μm[5,7]. However, it still produces a noticeable grating diffraction effect. Light passing through or reflected from the dead area has a similar effect as the result of type 1 unmodulated light. It causes a zero-diffraction-order light spot at the optical axis and the higher-order replicas on the reconstruction plane for a Fourier hologram or multiple bright backgrounds on the reconstruction plane of a Fresnel hologram. The difference between the type 1 and the type 2 unmodulated lights is that dead areas are located periodically, the same as pixel cells, so it works as a 2D grating (matrix) and produces a diffraction pattern.
Note that the dead area effect can be improved in theory by coating the dead area with an AR layer in the reflective-type SLMs or a mask in the transmissive-type SLMs[4] without the property of the active area. However, this is practically difficult, and the AR coating does not work for the whole visible range light anyway.
The relation between the diffraction angle of different orders, , and the angle of the illumination light, , can be written as , where is the diffraction order number, is the light wavelength, and is the grating pitch. It can be simplified to , assuming is zero (perpendicular illumination)[8].
One thing in need of clarification is that a “zero-diffraction-order” in this Letter means the central diffraction light () among multiple diffraction orders [, where ]. In the holographic image reconstruction by using SLMs, zero-diffraction-order normally means the central part of type 2 unmodulated light, which accidentally has the same position of the bright spot caused by the type 1 unmodulated light, since the glass surface and the back panel are parallel.
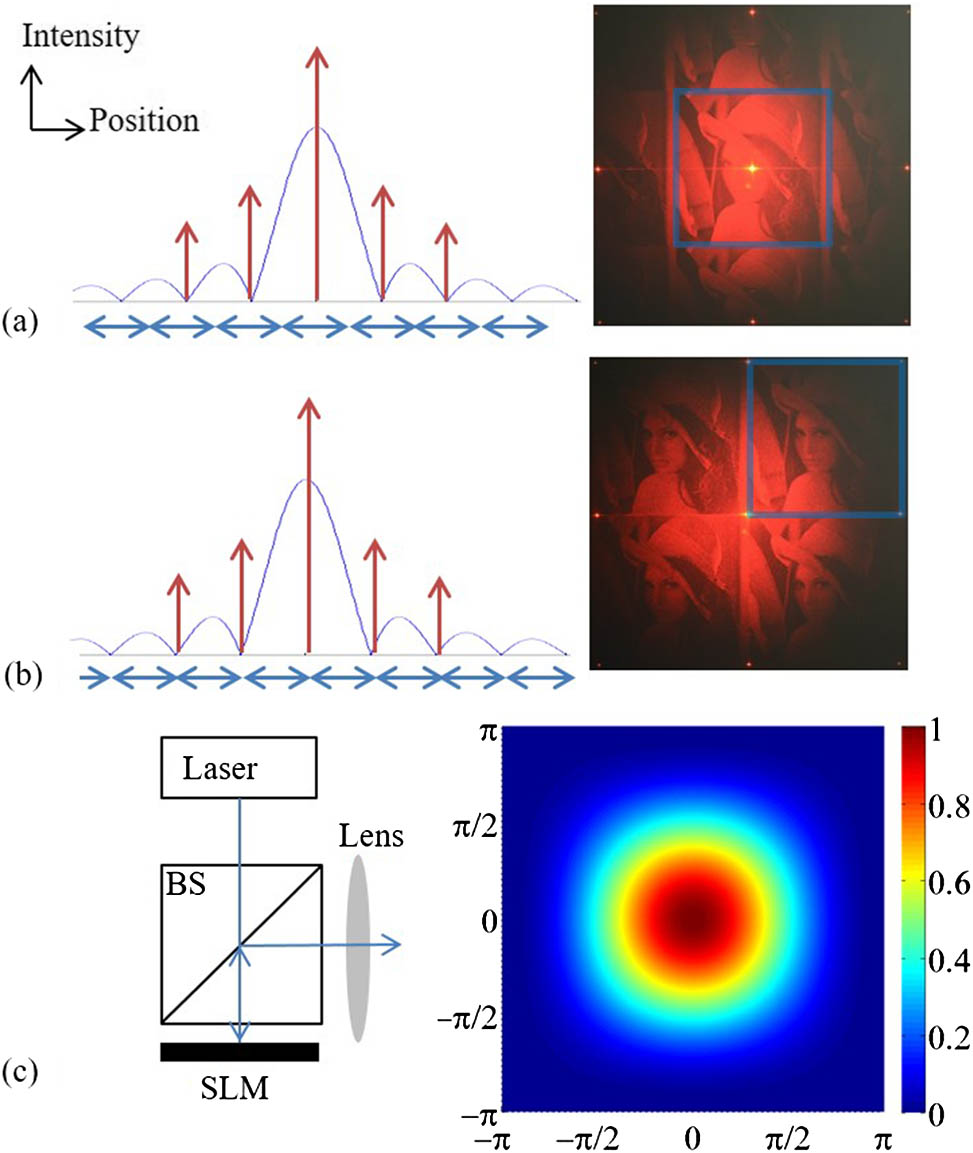
When using a pixelated SLM to generate a holographic image, there are multiple replicative images of high diffraction orders due to the pixelation effect, as labeled by the blue arrows in Figs. 1(a) and 1(b). The diffraction angle between two orders is the same for the holographic image reconstruction because the grating diffraction of the dead area shares the same pixel pitch on the same device. Each order of the reconstructed image comes with high-diffraction-order replicative images caused by the grating diffraction of the unmodulated light. For simplicity, these multiple replicative reconstruction images are called the zero-order image and high-order images, according to the zero-diffraction-order light and high-diffraction-order replicas, respectively. The Gerchberg–Saxton (GS) algorithm is used to calculate the hologram in this work. The optical setup of a Fourier hologram reconstruction from an SLM (a multiple level phase-only SLM in our case) is shown on the left of Fig. 1(c). The high-diffraction-order light is denoted by red arrows in Figs. 1(a) and 1(b). The blue squares in Figs. 1(a) and 1(b) mean the target image region. The central bright spot seriously interferes with the image and can be blocked by a mask after passing through a lens[9], but it unavoidably blocks some parts of information. The difference between Figs. 1(a) and 1(b) is that the image in Fig. 1(b) is shifted (can be done on calculation) away from the bright spots. It is also called the off-axis approach. However, it suffers from the pixelation effect, which is caused by the pixel structure of the SLM device. It creates an uneven (but symmetric) intensity distribution assuming a top-hat circular beam profile (actually a sinc function profile) on the reconstruction plane, as shown on the right of Fig. 1(c). The maximum intensity difference is 1.0 between the center and edge of the circular light distribution area, where the maximum intensity is set as 1.0, and the rest is the relative values.
Figure 1.(Color online) (a) On the left is the illustration of the intensity profile, in which the blue curve is the uneven intensity profile caused by the pixelation effect, red arrows are the bright spots from unmodulated light (the central bar is exceptionally longer because of both types of unmodulated light), blue arrows represent the repetitive reconstructed images. Note that this intensity profile is the 1D cross section parallel to the reconstruction and crossing the zero order. The Y axis is the intensity, and the X axis is the position. On the right is the physical reconstruction result of the Lenna; (b) similar to (a), but the image content is shifted, so the reconstructed images are located between two diffraction orders of bright spots; (c) the optical setup of a Fourier hologram reconstruction from an SLM, and the intensity distribution profile of 2D sinc function. The X axis and Y axis denote the positions in the intensity distribution profile of the 2D sinc function. The scale bar takes the maximum intensity as 1.0, and the rest is the relative values.
The uneven intensity effect on reconstruction images might be improved by pre-compensation; however, the uneven profile of the available image regions decreases to zero at the edge in the off-axis approach, where the pre-compensation cannot work.
Let us revisit the final reconstructed image, which is composed of the hologram reconstruction, uneven intensity profile from the pixelation effect, and bright strong spots from unmodulated lights. The reconstruction process can be expressed by Eq. (1), as in the case of a Fourier hologram reconstruction:
Reconstruction where means Fourier transformation, Holo is the hologram pattern, Aper is the aperture with the width and height of the hologram (SLM) size, ⊗ is the convolution operation, Comb is the sampling of a 2D pulse at an interval of width of the pixel pitch, RectPixel is the aperture with the width and height of the pixel pitch, is the reflection light from the SLM glass surface, and is the diffraction light from the dead area.
Furthermore, is equal to the target image. is equal to a 2D sinc function with the main lobe width of , where is the focal length of the imaging lens, the wavelength, and D the aperture size, which is the order of the size of the SLM. is equal to a 2D sinc function with the main lobe width of , where is the pixel size. means the bright spot caused by the type 1 unmodulated light, which equals , and Diff is the diffraction spots pattern caused by the dead area grating, which equals .
Finally, the effect of ‘’ is the speckle noise in Ref. [10], and the effect of ‘’ is to multiply the image with an uneven intensity mask, where the profile is the same as that of a 2D sinc, as shown in Fig. 1(c).
Note that the situation is similar for the Fresnel hologram. The reconstructed image can be allocated at any depth, and either mask or image shift (off-axis) can be used to avoid the interference of and .
The work in Ref. [11] tried to destruct zero-diffraction-order of the SLM dead area by including the effect in hologram calculation. This not only is computationally heavy, but also effectively dilutes the available information bandwidth, as the calculation needs to consider how to destruct the zero-diffraction-order. Besides, this method is setup and device dependent and not general. On the other hand, the work in Ref. [12] proposed to mix the mask blocking and calculation to destruct zero-diffraction-order. However, it is unavoidable to lose some available information and increases the hologram computational load due to the extra calculation.
Here, we propose a simple and practical solution to minimize the zero-diffraction-order from unmodulated light, while having a compensable intensity profile for image uniformity. The main concept is to overlay images of different orders. It can work well for two reasons: the hologram reconstruction part [ in Eq. (1)] produced by lights with different incident angles delivers the same amplitude information with the location shifting and the reconstruction of different higher-order images caused by the pixelated SLM has the same amplitude information with different intensity decay profiles (same shape but different decreasing direction). The advantages of this approach are that no extra hologram needs to be calculated, no extra coating is necessary, no external device is needed except one beam splitter and two mirrors, and it can be applied to all types of pixelated SLMs. Its simplicity makes this method general and feasible.
An optical experiment is performed to show the feasibility of the proposed method. An illustration of the optics setup is shown in Fig. 2(a). To implement the method, the image content is shifted horizontally away from the central bright spot by adding a linear phase profile to the hologram. Then, the light source is divided into two by a beam splitter. Two mirrors are placed behind the beam splitter to adjust the directions of the reflective lights. The aim is to adjust the reconstructions from two different illumination lights to match each other’s different-order replicas. The zero-order-diffraction of one reconstruction is totally overlapped to the first-order diffraction of the other reconstruction, as shown in Fig. 2(b). Once those two bright diffraction spots from the unmodulated light overlap, the reconstructed holographic images of different orders overlap, and those bright spots stay at the edge of the available region. The reconstructed Lenna in our case is around , and it is easy to match two images with such scale, which can be achieved manually.
Figure 2.(Color online) (a) Optics setup illustration. Two laser beams, split from the same beam by a beam splitter (BS), are colored with red dashed lines and blue straight lines. The 1D cross section intensity profile is also illustrated underneath; (b) left, the matching of two 1D cross section intensity profiles; right, the intensity profile after overlapping two profiles, while the black arrows mean the bright spots; (c) left, the intensity 2D distribution of the image region; right, the physical reconstructed Lenna image with the outline square box corresponding to the area of the intensity distribution on the left. The reconstruction applies multiple frames with random phase to reduce the speckle noise[13].
This method can compensate the intensity and reduce its max intensity difference to 0.7748, as on the left of Fig. 2(c). It shows that the intensity difference reduces more along the overlapping direction than the other one. In general, it has a better uniformity than that in Fig. 1, of which the maximum intensity difference is one.
For two illumination plane waves, they interfere and create a diffraction fringe[8]. The angle between the two illumination plane waves, , is adjusted to be equal to the diffraction angle of the first order of the SLM pixelation grating in order to match two orders, as done in Fig. 2. This makes the interference fringe equal to the pixel pitch, and it can still project the reconstruction image from the hologram, while the destructive interferences are totally located in the dead area, which reduces the impact of the high-order diffraction, as significantly less light illuminates the dead area, as shown in Fig. 3. Further analysis and discussion about the reduction of high-order diffraction impact will be carried out in the future.
Figure 3.(Color online) (a) Shows the effective illumination light interference from two plane waves onto the SLM with the fringe size equal to pixel pitch; (b) shows the 1D cross section of the interference pattern intensity and the pixel structure; (c) shows that some dead area shines almost without illumination (dotted grey), some dead area with illumination (red stripes), and active area with the most illumination (plain blue).
It should be pointed out that the images of different orders carry the same image information [] of amplitude and phase, and images from these two orders propagate to the exact direction if the matching is done correctly. Therefore, this approach can also be applied to 3D image reconstructions. In the reconstruction of a 3D image by Fourier hologram, matching images of two orders from two different reconstructions guarantees the match of propagation directions of two views, and they compensate each other’s uneven intensity profile along the propagation direction.
The overall reconstructed results show that it effectively shifts the bright spots to the edge of the images and maintains a good evenness, which solves the problems of unmodulated lights and pixelation effect, while keeping the good quality of target reconstruction.
The proposed approach can be further improved by applying four shifted image overlapping, as shown in the Fig. 4. Two beam splitters and four mirrors are necessary to produce four reconstruction images. One set shifts light at the horizontal axis, while another set shifts light at the vertical axis. Once they match each other, as done in Fig. 2, but in both the horizontal and vertical axis, their delivered information matches, and the final image region intensity distribution can be even more uniform, as shown in the lower–right corner of Fig. 4. The intensity difference is reduced to 0.6914. The results show that the intensity difference are the same in both horizontal and vertical directions, which provides better evenness than that in Fig. 2. It is expected that the effect on reducing illumination light on the dead area is even better in the setup of overlapping four orders.
Figure 4.Illustration of the optics setup for four reconstruction image overlapping. Note that only two beams are drawn, since it is a cross section illustration. There are four beams on the axis (pointing to the paper).
However, the extra use of beam splitters decreases the optical power, and the extra alignments are required. All these increase the complication of the implementation. Nevertheless, two reconstruction images overlapping is easier to set up and has similar performance, which is practically preferred.
In conclusion, overlapping multiple shifted holographic reconstruction images can reduce the intensity unevenness and avoid the bright spots caused by the unmodulated light. The proposed approach can be easily implemented on SLMs without physical alteration. The setup requires only additional beam splitter(s) and mirrors. This method may also be used to improve the quality of images in other image restoration cases[14].
Jhen-Si Chen, Jia Jia, Daping Chu. Minimizing the effects of unmodulated light and uneven intensity profile on the holographic images reconstructed by pixelated spatial light modulators[J]. Chinese Optics Letters, 2017, 15(10): 100901