
Yanwen Hu, Shiwang Wang, Junhui Jia, Shenhe Fu, Hao Yin, Zhen Li, Zhenqiang Chen, "Optical superoscillatory waves without side lobes along a symmetric cut," Adv. Photon. 3, 045002 (2021)
- Advanced Photonics
- Vol. 3, Issue 4, 045002 (2021)
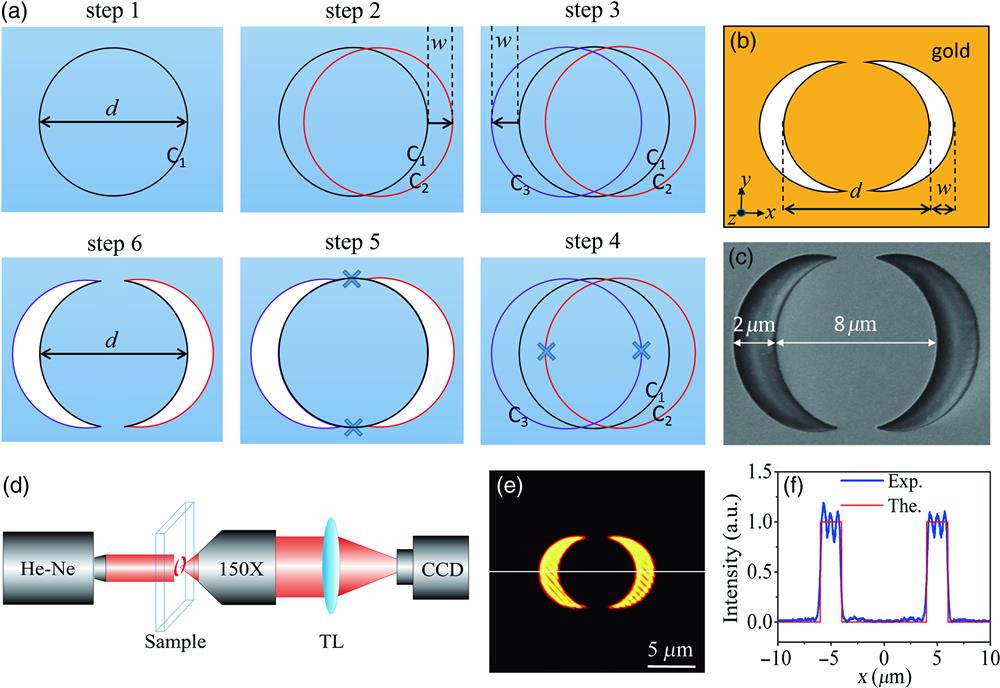
Fig. 1. Principle for generating the no-side-lobe optical superoscillatory waves with a pair of symmetric moonlike apertures. (a) Design processes for the moonlike apertures. (b) The moonlike apertures were fabricated with an extremely thin gold film deposited on a glass substrate. (c) An electron micrograph of one of the fabricated samples. (d) Experimental setup used to validate the binary amplitude modulation of the moonlike apertures as well as to measure the diffractive waves in the far field with an He–Ne laser working at a wavelength of
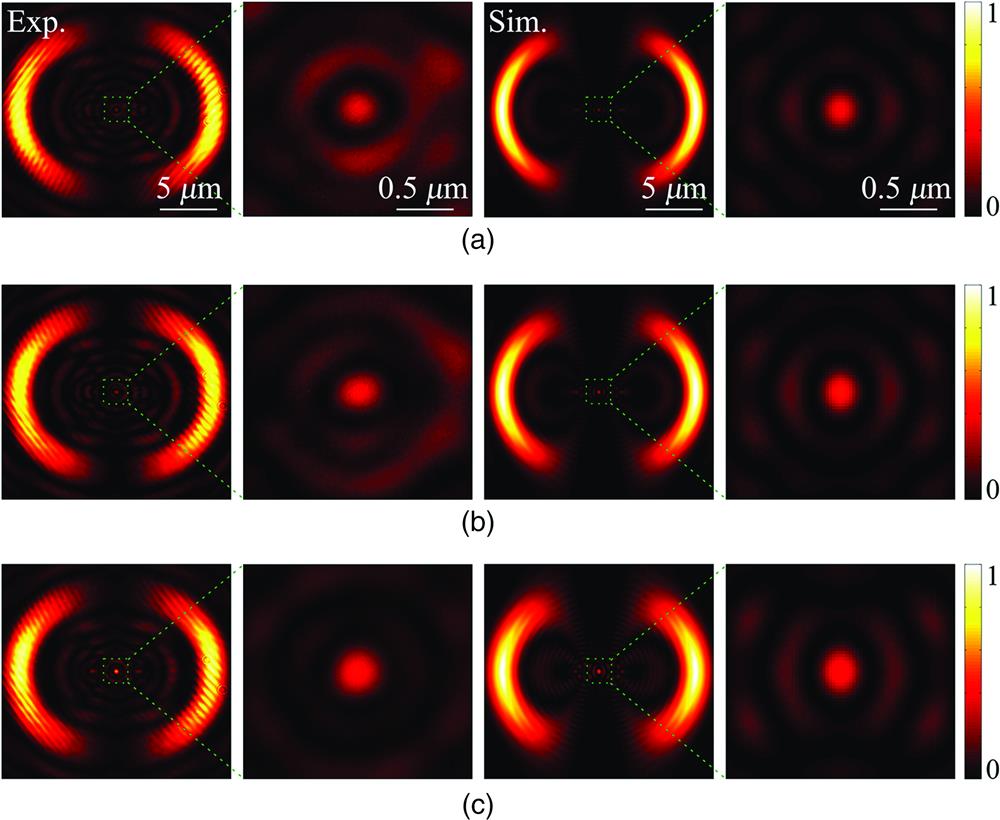
Fig. 2. Experimental and numerical demonstrations of the generated superoscillatory light waves with the moonlike nanostructure (parameters:
Fig. 3. The intensity cross-sections of the superoscillatory lobes at different distances: (a), (b)
Fig. 4. Generation of the superoscillatory light waves with a smaller moonlike nanostructure (
Fig. 5. Free-space propagation of the generated superoscillatory waves. The panels depict the measured intensity distributions of the light waves in the


Set citation alerts for the article
Please enter your email address

© Copyright 2018-2021 | Chinese Laser Press. All Rights Reserved 沪ICP备15018463号-20