Xin Wang, Sihua Yang. Imaging of human wrist joint by a flexible-transducer-based morphological-adaptive photoacoustic tomography: a feasibility study[J]. Chinese Optics Letters, 2019, 17(9): 091701
Copy Citation Text
In this study, the feasibility of visualization of human joints using photoacoustic tomography (PAT) is investigated. To verify this idea, the system of integrated optical fiber bundles and a custom-made flexible transducer is established, both of which give the advantage of morphological adaptation; therefore, the coupling section can be worn on human limbs. The imaging capacity of the flexible-transducer-based PAT system is validated by mapping the structures of the finger and the wrist joint. To the best of our knowledge, it is the first time to achieve photoacoustic imaging of such large human wrist joints. The cross-sectional photoacoustic images of a healthy joint clearly exhibit the main internal structures, including the phalanx, tendons, and blood vessels, which are comparable with the corresponding images by 3.0 T magnetic resonance imaging. The experimental results demonstrate that the proposed system holds promise for early diagnosis of joint disorders.
Arthritis is a major cause of disability in the adult population and is associated with limited physical activity, work disability, reduced quality of life, and high health care costs, affecting millions of people around the world[1]. There are two common types of arthritis: osteoarthritis (OA) and rheumatoid arthritis (RA). According to a clinical survey, half of the people over 50 years old suffer from OA that results in swelling, stiffness, and pain of distal interphalangeal (DIP) joints, proximal interphalangeal (PIP) joints, wrists, ankles, knees, and shoulders[2]. Therefore, the development of joint imaging technology will benefit the early diagnosis and later optimized treatment of these diseases. Nowadays, common clinical techniques used in joint diagnosis include X-ray imaging, magnetic resonance imaging (MRI), and ultrasound (US) imaging. However, the existing methods have limitations. For example, X-ray imaging is a radiating and ionizing imaging method, which is potentially carcinogenic to the human body and insensitive to soft tissues[3]. The high price as well as the low imaging speed of MRI limits the applications in joint detection[4]. US imaging suffers from low imaging contrast and is often used to evaluate the thickness of joint cavities that commonly changes in intermediate and advanced stages[3,5]. Therefore, there is an urgent need to develop new technology that can overcome these difficulties.
In recent years, photoacoustic tomography (PAT) has attracted more and more attention from researchers all over the world. It is widely used in tumor detection, angiography, microcirculation abnormalities, joint imaging, and other biomedical fields[6–11]. Significant absorption contrast between diseased and normal joints has been observed in the hand with OA[12] and RA[13]. For example, for an osteoarthritic joint, the ratio of its cartilage absorption coefficient to that of the associated bone is increased by 40% relative to the healthy joints[12]. Research data also indicates that the hemoglobin levels in OA joints are higher than that of healthy phalanges, while finger phalanges with OA disease seem to have lower oxygen saturation levels than healthy phalanges[14]. Since the high absorption contrast of different parameters is available to PAT, it is expected that PAT can represent the internal optical-absorption-based contrast for joint imaging. Therefore, several PAT systems have been reported to evaluate the feasibility of human finger joint imaging, such as Wang et al.[1,15], Sun et al.[16,17], Xiao et al.[18], Xi et al.[19,20], Manohar et al.[21], Lutzweiler et al.[22], Xu et al.[23], and Chi et al.[24]. In previous reports of photoacoustic (PA) joint imaging, the detection part of the system consists of several acoustic detectors, which cannot achieve real-time imaging. The problem may be solved in the future because several groups[25,26] have devoted their efforts in the development of hardware and algorithms for real-time PA imaging (PAI) in two and three dimensions. So far, it has been limited to imaging the human finger joints, with no studies on large joints such as wrists and ankles, since the device cannot be worn on human limbs, which restricts its clinical applications.
Recently, a flexible detector has been designed that has good applications in both PAI and thermoacoustic imaging for breast tumor detection[27,28]. In this study, the feasibility of the morphological-adaptive PAT for large human joints is investigated. Our goal is to present a method for noninvasively imaging human joints based on optical fiber bundles (OFBs) and a flexible transducer (FT). This is the first time, to the best of our knowledge, that a flexible detector has been used for PA joint imaging, and the 128-element FT is arranged into a bracelet-shaped housing so that it can be mechanically mounted on the volunteer wrist, combined with the flexible light source (OFBs) to form a morphological-adaptive PA joint imaging system. The weight of the transducer (except cable) itself plus the housing is about 800 g, allowing for mobility of the human without affecting imaging, and the strategy of US detection plus laser illumination makes PAT achievable in an awake human. The present manuscript describes a method where a coupling section can be carried by an awake human for noninvasive, high-speed joint imaging. The performance of the proposed method is demonstrated by the experiments of the finger and wrist joints. It could not only image the internal structure of human finger joints, but also obtain PAI of human wrist joints for the first time, to the best of our knowledge. The results show the potential of the imaging method for clinical applications in early detection of joint diseases such as OA.
Sign up for Chinese Optics Letters TOC. Get the latest issue of Chinese Optics Letters delivered right to you!Sign up now
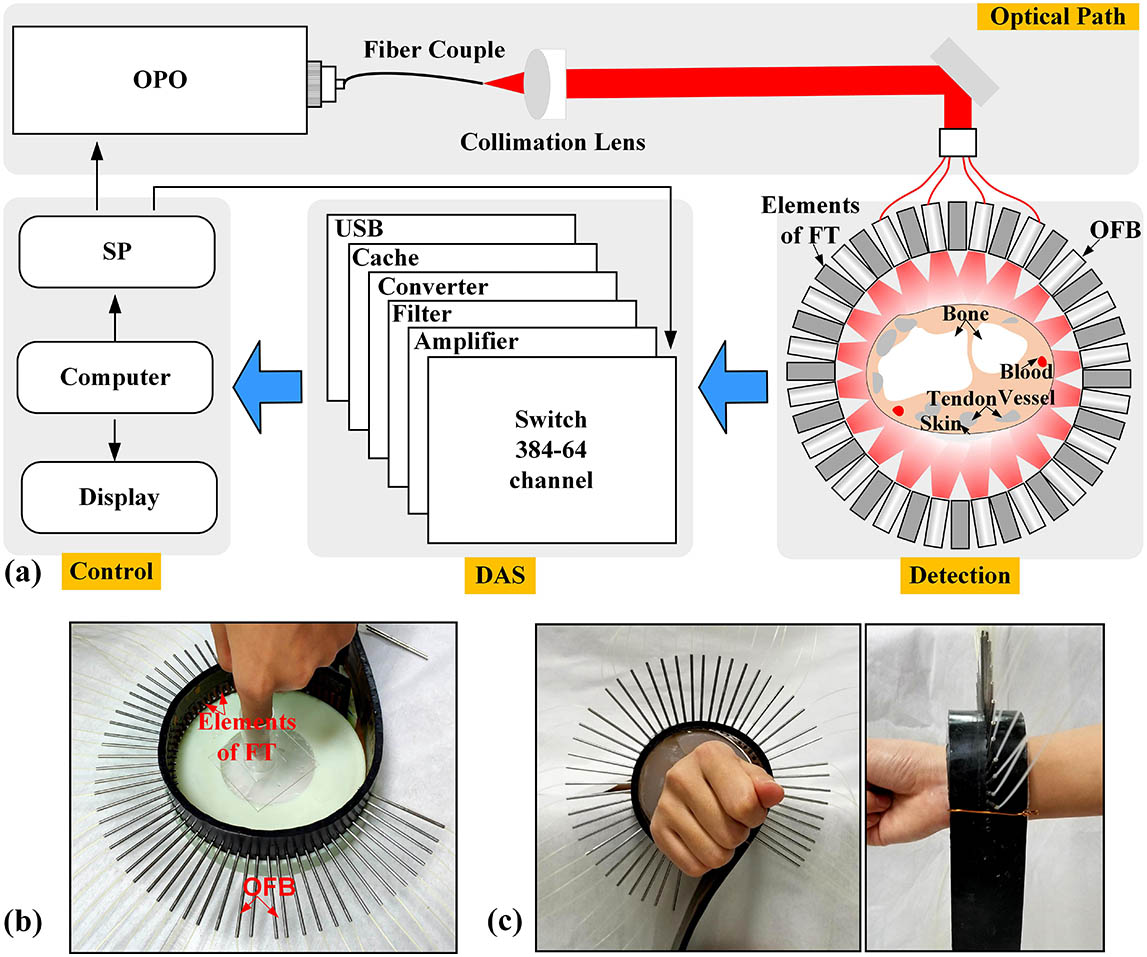
The schematic diagram of the experimental device is shown in Fig. 1(a). A tunable optical parametric oscillator (OPO) laser (Surelite plus-II 20, Continuum, USA) triggered by the synchronization pulse (SP) emits a laser beam with a duration of 6 ns and a repetition rate of 20 Hz at a wavelength of 720 nm. The laser energy is detected to be approximately 40 mJ per pulse. The 720 nm wavelength is selected as the excitation source, mainly because the laser in the near infrared (NIR) window enables good penetration depth into the articular tissues. At 720 nm, hemoglobin and melanin are the dominant absorbers in the finger. Then, the laser beam delivered by a quartz optical fiber (600 μm in diameter at the core) is coupled into the fiber end face (1.76 mm in diameter) of OFBs (WF 200/220/245 P, CeramOptec, Germany) via a collimation lens. The OFB can split one laser beam into 64 beams via beam splitter cubes. The laser beams transmitted by the OFB illuminate the surface of the human joint, providing a uniform light distribution in the imaging plane. In addition, since each of the light-emitting ends of the OFB is oriented toward the center, the absorber can receive all the light from the axial direction, resulting in higher energy utilization. The generated wideband PA signals are detected by the FT.
Figure 1.(a) Schematic of the PAI system for joint imaging. FT, flexible transducer; DAS, data acquisition system; SP, synchronization pulse; OFBs, optical fiber bundles. (b) PAI joint interface for distal interphalangeal (DIP) joint imaging. (c) Front and side views of the PAI joint interface for wrist joint imaging.
Considering the combination of resolution and imaging depth, the 128-element FT (10S128-1.0*5, Doppler Ltd., China) is used as an energy converter from US to an electrical signal with the central frequency of 10 MHz and 70% bandwidth. The transducer is made of composite material, consisting of piezoelectric ceramic (PZT) and polyvinylidene fluoride, and the substrate is made of rubber. This design not only ensures the detector’s high sensitivity but also flexibility, allowing it to be easily fabricated in donut-like or many other shapes. The smallest curvature radius is about 5 mm, which is the minimum degree to which the detector and the array element can be bent. The effective length of the non-focusing transducer is 12.7 cm, and each element has a size of . The thickness of the substrate material of the detector is 4 mm. Then, the morphological-adaptive PAT for large human joints based on the FT and OFB is formed.
The overall workflow of the system is described in Fig. 1(a). The laser is transmitted through the OFB to the sample, and the PA effect occurs, producing PA signals. Then, PA waves travel through the boundary of the tissue and can be captured by the FT, and the signals from each element are amplified, filtered, converted, and acquired by two 32-channel acquisition cards (5752, National Instruments, USA) with a sampling rate of 50 MHz, which are rebuilt into a two-dimensional (2D) image by a shape-adapted back projection algorithm[27], with the imaging speed about 10 frames per second[28]. Figures 1(b) and 1(c) show photographs of the PA imaging interface for DIP joint and wrist imaging. Before imaging reconstruction, a synthetic aperture method is used to calibrate the position of detector element by using a point absorber. In this process, it is assumed that the position of the sample is the origin (0, 0), the distance between the element and sample is known, and the solution of other elements is where ; is the distance matrix between element and the point absorber; is the distance between the two elements’ centers. Then, the back projection algorithm is used for image reconstruction. The adaptive back projection formula can be written as where is the original time-domain signal matrix with element and ; is the total number of elements; is acoustic velocity.
In summary, the data processing procedure can be written as where and are operators described by Eqs. (1) and (2), respectively. Completing the above two works, a 2D PA image can be reconstructed.
To test the lateral resolution, the sample is made from a black human hair with a diameter of 80 μm in a solid tissue mimicking phantom with an optical absorption coefficient of and a reduced scattering coefficient of [20]. The solid tissue mimicking phantom has a diameter of about 6 cm and a height of about 3 cm, and the shape is a cylinder, similar to the human wrist section. As shown in Fig. 2(a), the system could accurately recover the position and shape of the hair. Figure 2(b) plots the normalized pixel value profile of the cross-sectional image along the link marked in Fig. 2(a). The imaged size [Fig. 2(b)] is 200 μm, which determines the maximum lateral resolution of this system. Then, the experiment about a penetration depth at 720 nm wavelength is performed. A series of carbon rods with a diameter of 200 μm are embedded at different depths in the above solid tissue mimicking phantom. Their spatial position relationship is shown in Fig. 2(c). The normalized amplitude curves of PA signals of carbon rods at different depths are depicted in Fig. 2(d).
Figure 2.(a) Typical cross-sectional PA image of a black human hair. (b) Quantitative analysis of the imaged size of the human hair. (c) The schematic of the phantom. (d) Normalized amplitude of the PA signal of the absorber at different depths.
Different from a traditional beam with Gaussian distribution, an OFB has the unique merit of flexibility and high degree of freedom, allowing it to be easily expanded freely, to provide a uniform light distribution in the imaging plane. To examine the performance of the OFB, Fig. 3(a) shows the wavelength dependence with attenuation of the optical fiber. It can be seen that the attenuation of the optical fiber at the 720 nm wavelength is relatively small, about 5 dB/km (the total length of the fiber is 2 m), where the fiber transmittance can reach 99.9%. To test the laser power flatness of the OFB, the average power of the 64 outputs of the OFB is measured with an optical power meter, as shown in Fig. 3(b). However, the coupling efficiency and the uniformity of distribution are trade-offs, and therefore, the coupling efficiency is improved but the uniformity is relatively decreased. The proposed OFB provides a better uniformity of intensity distribution of light compared to the traditional beam with Gaussian distribution[27,29]. In fact, the light source is the fundamental factor affecting the uniformity. By using a light source with uniform intensity distribution as an excitation source, the problem can be fundamentally solved.
Figure 3.Performance of the excitation source and FT. (a) The dependence of the attenuation of the optical fiber on wavelength. (b) The intensity distribution of 64 outputs of the OFB. (c) Curve A, time-domain signal of the FT with a 10 MHz mechanical resonant frequency stimulated by 720 nm pulse laser; curve B, corresponding frequency spectrum to A. (d) Sensitivity of each element.
Figures 3(c) and 3(d) demonstrate the characteristic of the FT. A human hair (about 80 μm in diameter) serves as the optical absorber. Curve A in Fig. 3(c) between the red lines is the PA signal, a bipolar signal, whose width is approximately 300 μm. After Fourier transform, Curve B reflects the spectral information of the signal. The central frequency of this system is about 10 MHz, which is consistent with the center frequency of 10 MHz of the FT. At the same time, it can be seen that the two frequencies at the bandwidth of 0.5 are about 5 and 12 MHz, respectively. To test the sensitivity flatness, a pulse generator is used to emit pulses, and the oscilloscope is used to observe the echo signal of each channel; the measurement results are shown in Fig. 3(d). The sensitivities of the 128 channels are centrally distributed from to . The variance () indicates that the difference of the sensitivity has a tiny variation. Therefore, the bandwidth and sensitivity can fulfil the demands of high sensitivity and high resolution of joints imaging.
After system performance evaluation, the PA imaging experiments on healthy DIP joints of the index finger of a 25-year-old female left hand are performed. The volunteers’ fingers are fixed in a hollow cylinder about 1.5 cm in diameter and 8 cm in height at the geometric center of the upper surface of the cylindrical mold. Then, the fixed mold is placed in a higher tank filled with deionized water, and the horizontal plane passes through the array plane of the transducer. Figure 4(a) shows the positions of selected imaging planes of a female index finger and the corresponding PA images. The phalanx (PH) and tendons (TE) in the DIP joints can be clearly identified. In addition, it can be seen from Fig. 4(a) that the structural differences between different selected imaging planes are well recognized within the active imaging area, and meanwhile, the arteries in the joints are well imaged. In Fig. 4(b), we compare the PA image with the corresponding MRI image, and it appears that several types of joint tissue are visible, including the PH, artery (AR), and TE. The results indicate that the major structures in the PA image are basically consistent with those in the MRI images, suggesting that the resolution of the system is comparable to that of the 3.0 T MRI (Discovery MR750 3.0 T, The Sixth Affiliated Hospital, Sun Yat-sen University, China).
Figure 4.(a) Two cross-sectional PA images and selected imaging positions of DIP joints in a female index finger. PH, phalanx; TE, tendon; AR, artery. (b) Comparison between the PA image and the corresponding MRI image.
To evaluate the potential of the method for large joints imaging in a still awake human, the PAT of the volunteers’ wrist joints is next implemented. In the process of PA signals coupling, agar and a small amount of US coupling fluid are used to ensure that there are no blind areas in the signal reception. Figures 5(a) and 5(b) present the location of the selected imaging area in a female left wrist and the cross-sectional PA images of wrist joints, while similar cross sections of the wrist joint from the same volunteer by MRI are given in Fig. 5(c) for comparison. Because there are chromophores such as hemoglobin and myoglobin in the blood and TEs, these substances have large absorption at the excitation wavelength. Comparing the PA images with the MRI, arteries and most superficial TEs are readily evident. The study presents for the first time in vivo experimental evidence that the proposed method has the potential for imaging large human joints such as wrists, ankles, and knees.
Figure 5.(a) Photograph of the location of the selected imaging area in a female left wrist. (b) Cross-sectional PA images of wrist joint. TE, tendon; AR, artery. (c) The corresponding MRI images.
In summary, combining the shape-controllable flexible detector with the high degree of freedom of OFBs provides PAT with the merit of morphological adaptation. We have conducted experiments based on the developed method, receiving the PA internal structures of finger joints and obtaining the PAI of human wrist joints for the first time, to the best of our knowledge. However, there are still some weaknesses in the system that need to be improved. The illumination of the OFBs is not a closed loop since there is a small gap at the junction between the head and the tail when the detector is fixed. The elements at the tail are not connected to the head along the circular path, but have a certain angular deviation. Therefore, there is no laser irradiation in a small range of angle of about 15° (much less than 360°), which has little effect on the imaging results. It can also be found that the tiny blood vessels, ulna, and deep TEs within the joint are not well imaged [Fig. 5(b)] due to the resolution, limited penetration depth, and optical energy density of the excitation source. Therefore, due to the penetration depth of the excitation source, the system can only image part of the structure of the human knuckles and wrist joints at present. However, it is also possible by using higher-energy lasers and longer-wavelength NIR light, which enables sufficient penetration in biological tissues, although PAT of larger human joints such as ankle and knee joints is more difficult. In addition, to improve the resolution, multi-element detectors with smaller size and a larger number of array elements are needed.
In conclusion, we have built a PAT system by the FT coupled with OFBs. The advantage of morphological adaptation and the strategy of US detection plus laser illumination make PAT achievable in an awake human. The results from both healthy human finger joints and wrist experiments have demonstrated the feasibility of this system for noninvasive imaging of major structures in the DIP joints with sufficient resolution and possibility of imaging large joints. Therefore, the proposed PAT is expected to be applied in the detection of human joint diseases, especially large joints such as wrist, ankle, and knee joints.
Xin Wang, Sihua Yang. Imaging of human wrist joint by a flexible-transducer-based morphological-adaptive photoacoustic tomography: a feasibility study[J]. Chinese Optics Letters, 2019, 17(9): 091701