
Rong-hua GAO, Lu FENG, Yue ZHANG, Ji-dong YUAN, Hua-rui WU, Jing-qiu GU. Early Detection of Tomato Gray Mold Disease With Multi-Dimensional Random Forest Based on Hyperspectral Image[J]. Spectroscopy and Spectral Analysis, 2022, 42(10): 3226
- Spectroscopy and Spectral Analysis
- Vol. 42, Issue 10, 3226 (2022)
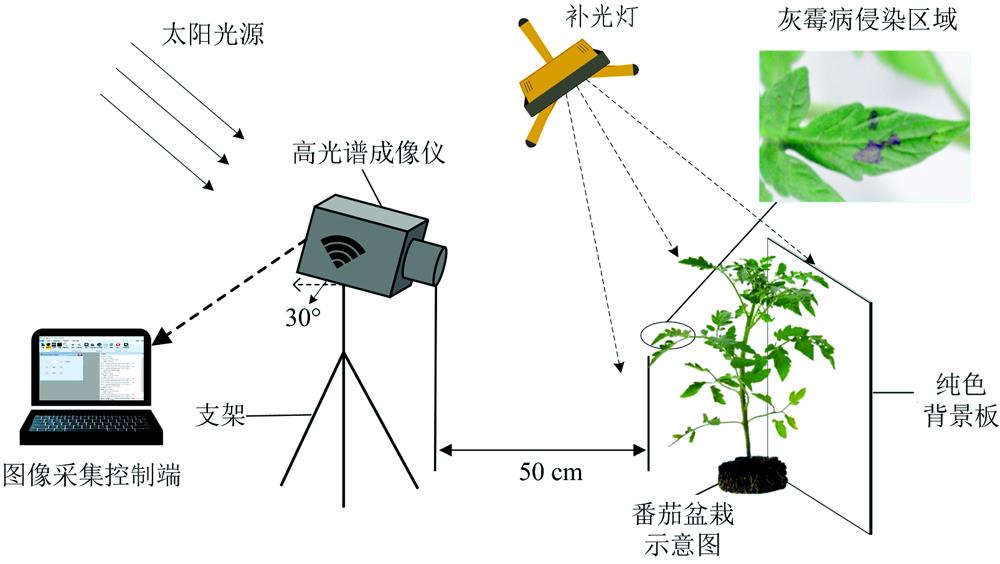
Fig. 1. Tomato leaves hyperspectral image acquisition diagram
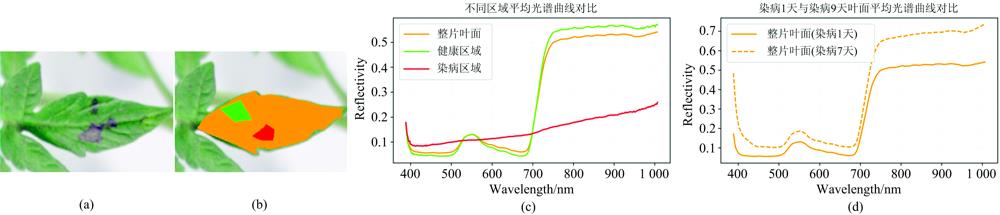
Fig. 2. Comparisons of reflectance of different ROIs after inoculation
(a): Tomato leaf on the 6th day after infection; (b): Different ROIs selection;(c): Comparisons of reflectivity of different ROIs; (d): Comparisons of reflectivity of leaf on the 1st and 9th day after infection
(a): Tomato leaf on the 6th day after infection; (b): Different ROIs selection;(c): Comparisons of reflectivity of different ROIs; (d): Comparisons of reflectivity of leaf on the 1st and 9th day after infection
Fig. 3. RGB image of leaves
Fig. 4. Changes of spectral reflectance of samples observed for 7 consecutive data
Fig. 5. Original series (a) and interrelated series (b)
Fig. 6. Symbolic aggregate approximation (SAX) method
Fig. 7. Symbolic Fourier approximation (SFA) method
Fig. 8. Hyperspectral curve of diseased and healthy leaves for 7 consecutive observations
(a): Consecutive 7-day reflectivity of infected leaf 1; (b): Consecutive 7-day reflectivity of infected leaf 2; (c): Consecutive 7-day reflectivity of healthy leaf 1; (b): Consecutive 7-day reflectivity of healthy leaf 2
(a): Consecutive 7-day reflectivity of infected leaf 1; (b): Consecutive 7-day reflectivity of infected leaf 2; (c): Consecutive 7-day reflectivity of healthy leaf 1; (b): Consecutive 7-day reflectivity of healthy leaf 2
Fig. 9. Recognition results of SDSS-SAX-SFA-MRF model
Fig. 10. Recognition results of MDSS-SAX-SFA-MRF model
(a): SFA multidimensional spectrum; (b): SAX multidimensional spectrum; (c): SAX+SFA multidimensional spectrum
(a): SFA multidimensional spectrum; (b): SAX multidimensional spectrum; (c): SAX+SFA multidimensional spectrum
Fig. 11. Comparison results of MDSS-SAX-SFA-MRF model and SDSS-SAX-SFA-MRF model
|
Table 1. Parameters of symbolic methods and weighted random forest model

Set citation alerts for the article
Please enter your email address
© Copyright 2018-2021 | Chinese Laser Press. All Rights Reserved 沪ICP备15018463号-20