
Hongying Zhang, Weimin Yang, Huisan Wang. 3D Face Recognition Combining Local Keypoints with Isogeodesic Curves Zhang Hongying[J]. Laser & Optoelectronics Progress, 2020, 57(22): 221503
- Laser & Optoelectronics Progress
- Vol. 57, Issue 22, 221503 (2020)
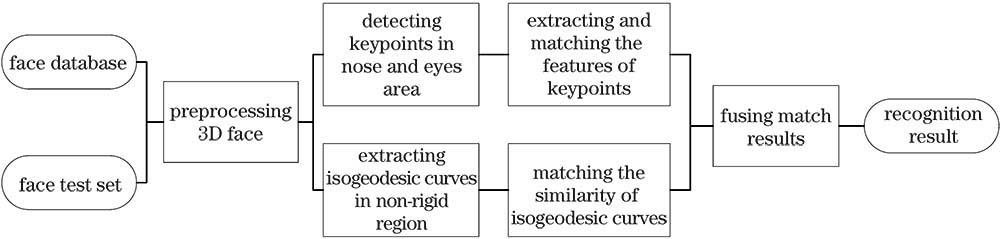
Fig. 1. Flow chart of our algorithm
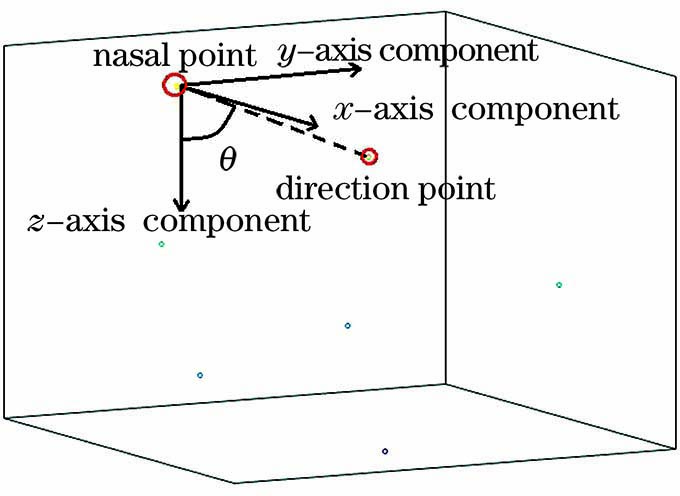
Fig. 2. Diagram of direction vector decomposition
Fig. 3. Point extracted in the nose root. (a) Points extracted along the direction vector ss-o; (b) point searched in the nose
Fig. 4. Extracted areas of the nose and eyes. (a) Nose area; (b) eyes area; (c) areas combing nose with eyes
Fig. 5. Definition process of coverage rate. (a) Feature points location; (b) feature points selection; (c) range partition; (d) coverage area
Fig. 6. Combination areas with different coverage rates. (a) 25% coverage rate; (b) 50% coverage rate; (c) 75% coverage rate; (d) 90% overage rate
Fig. 7. Combination area under different coverage rates after keypoints filtering. (a) 25% coverage rate; (b) 50% coverage rate; (c)75% coverage rate; (d) 90% coverage rate
Fig. 8. Four isogeodesic curves extracted in this paper
| |||||||||||||||||
Table 1. Face recognition rates in terms of different coverage rates unit: %
| ||||||||||||||||||||||||||||||||
Table 2. Face recognition rates in terms of different fusion coefficients unit:%
|
Table 3. Comparison of different algorithms on the Bosphorus database unit:%
|
Table 4. Comparison of different algorithms on the FRGCv2.0 database unit:%

Set citation alerts for the article
Please enter your email address
© Copyright 2018-2021 | Chinese Laser Press. All Rights Reserved 沪ICP备15018463号-20