• Photonics Research
  • Vol. 12, Issue 4, 804 (2024)
Xiaoyu Nie1、2, Haotian Song2, Wenhan Ren1、2, Zhedong Zhang3、5, Tao Peng1、*, and Marlan O. Scully1、4、6
Author Affiliations
  • 1Institute for Quantum Science and Engineering, Texas A&M University, College Station, Texas 77843, USA
  • 2School of Physics, Xi’an Jiaotong University, Xi’an 710049, China
  • 3Department of Physics, City University of Hong Kong, Hong Kong, China
  • 4Baylor University, Waco, Texas 76706, USA
  • 5e-mail: zzhan26@cityu.edu.hk
  • 6e-mail: scully@tamu.edu
  • show less
    DOI: 10.1364/PRJ.504327 Cite this Article Set citation alerts
    Xiaoyu Nie, Haotian Song, Wenhan Ren, Zhedong Zhang, Tao Peng, Marlan O. Scully. Deep correlated speckles: suppressing correlation fluctuation and optical diffraction[J]. Photonics Research, 2024, 12(4): 804 Copy Citation Text show less
    Diagram of Speckle-Net. Speckle-Net consists of multiple branches and two convolution layers within each branch. Subscripts j and i in Cji denote the jth layer and ith kernel in each layer. N kernels are adopted in each layer. A physical algorithm related loss function feedback is applied at the end of each branch to modify the kernels by gradient descent.
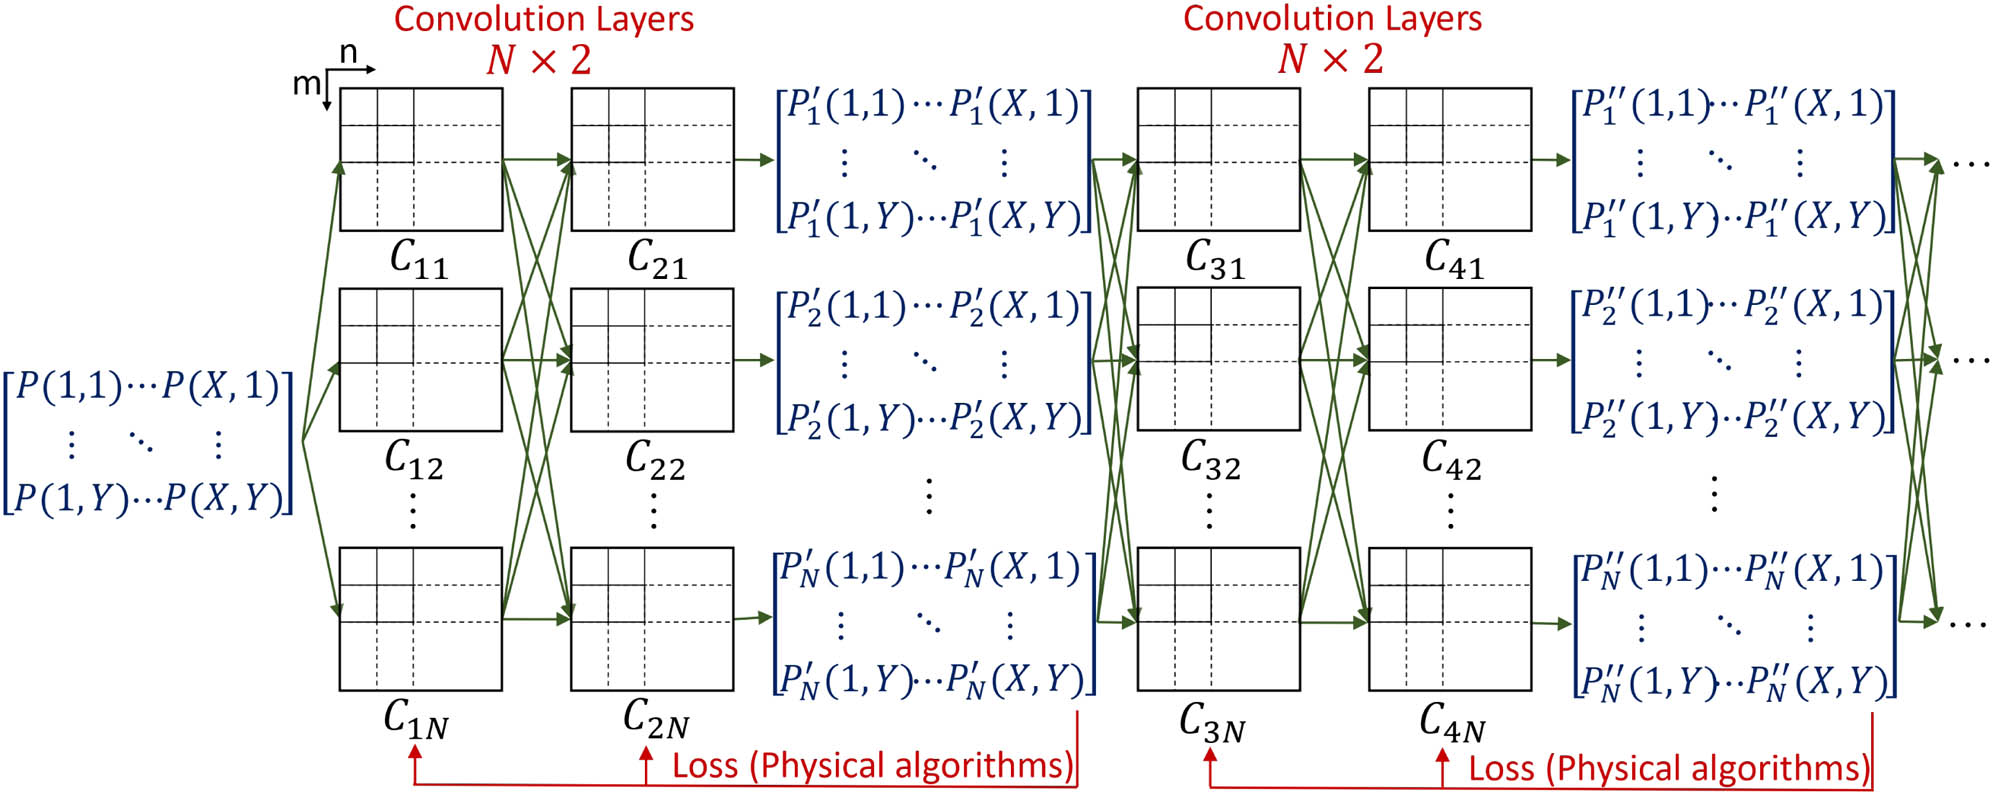
    Fig. 1. Diagram of Speckle-Net. Speckle-Net consists of multiple branches and two convolution layers within each branch. Subscripts j and i in Cji denote the jth layer and ith kernel in each layer. N kernels are adopted in each layer. A physical algorithm related loss function feedback is applied at the end of each branch to modify the kernels by gradient descent.
    (a) Left column: speckle patterns after three-branch Speckle-Net training with β=5%,2%,1%, and 0.5%. Middle column: Fourier spectra of the corresponding patterns (frequency components fx and fy increase from the center to edges). Right column: spatial intensity correlation distributions (correlation distance increases from the center to edges). (b) Spatial correlations of patterns with Speckle-Net and β=1%. (c) Spatial correlations (β=1%) of patterns generated by the diffuser plate. A k-space aperture is applied at the Fourier plane of patterns to control the correlation width the same as in (b). (d) Comparison between two methods with 1D plot along the dashed line marked in (a).
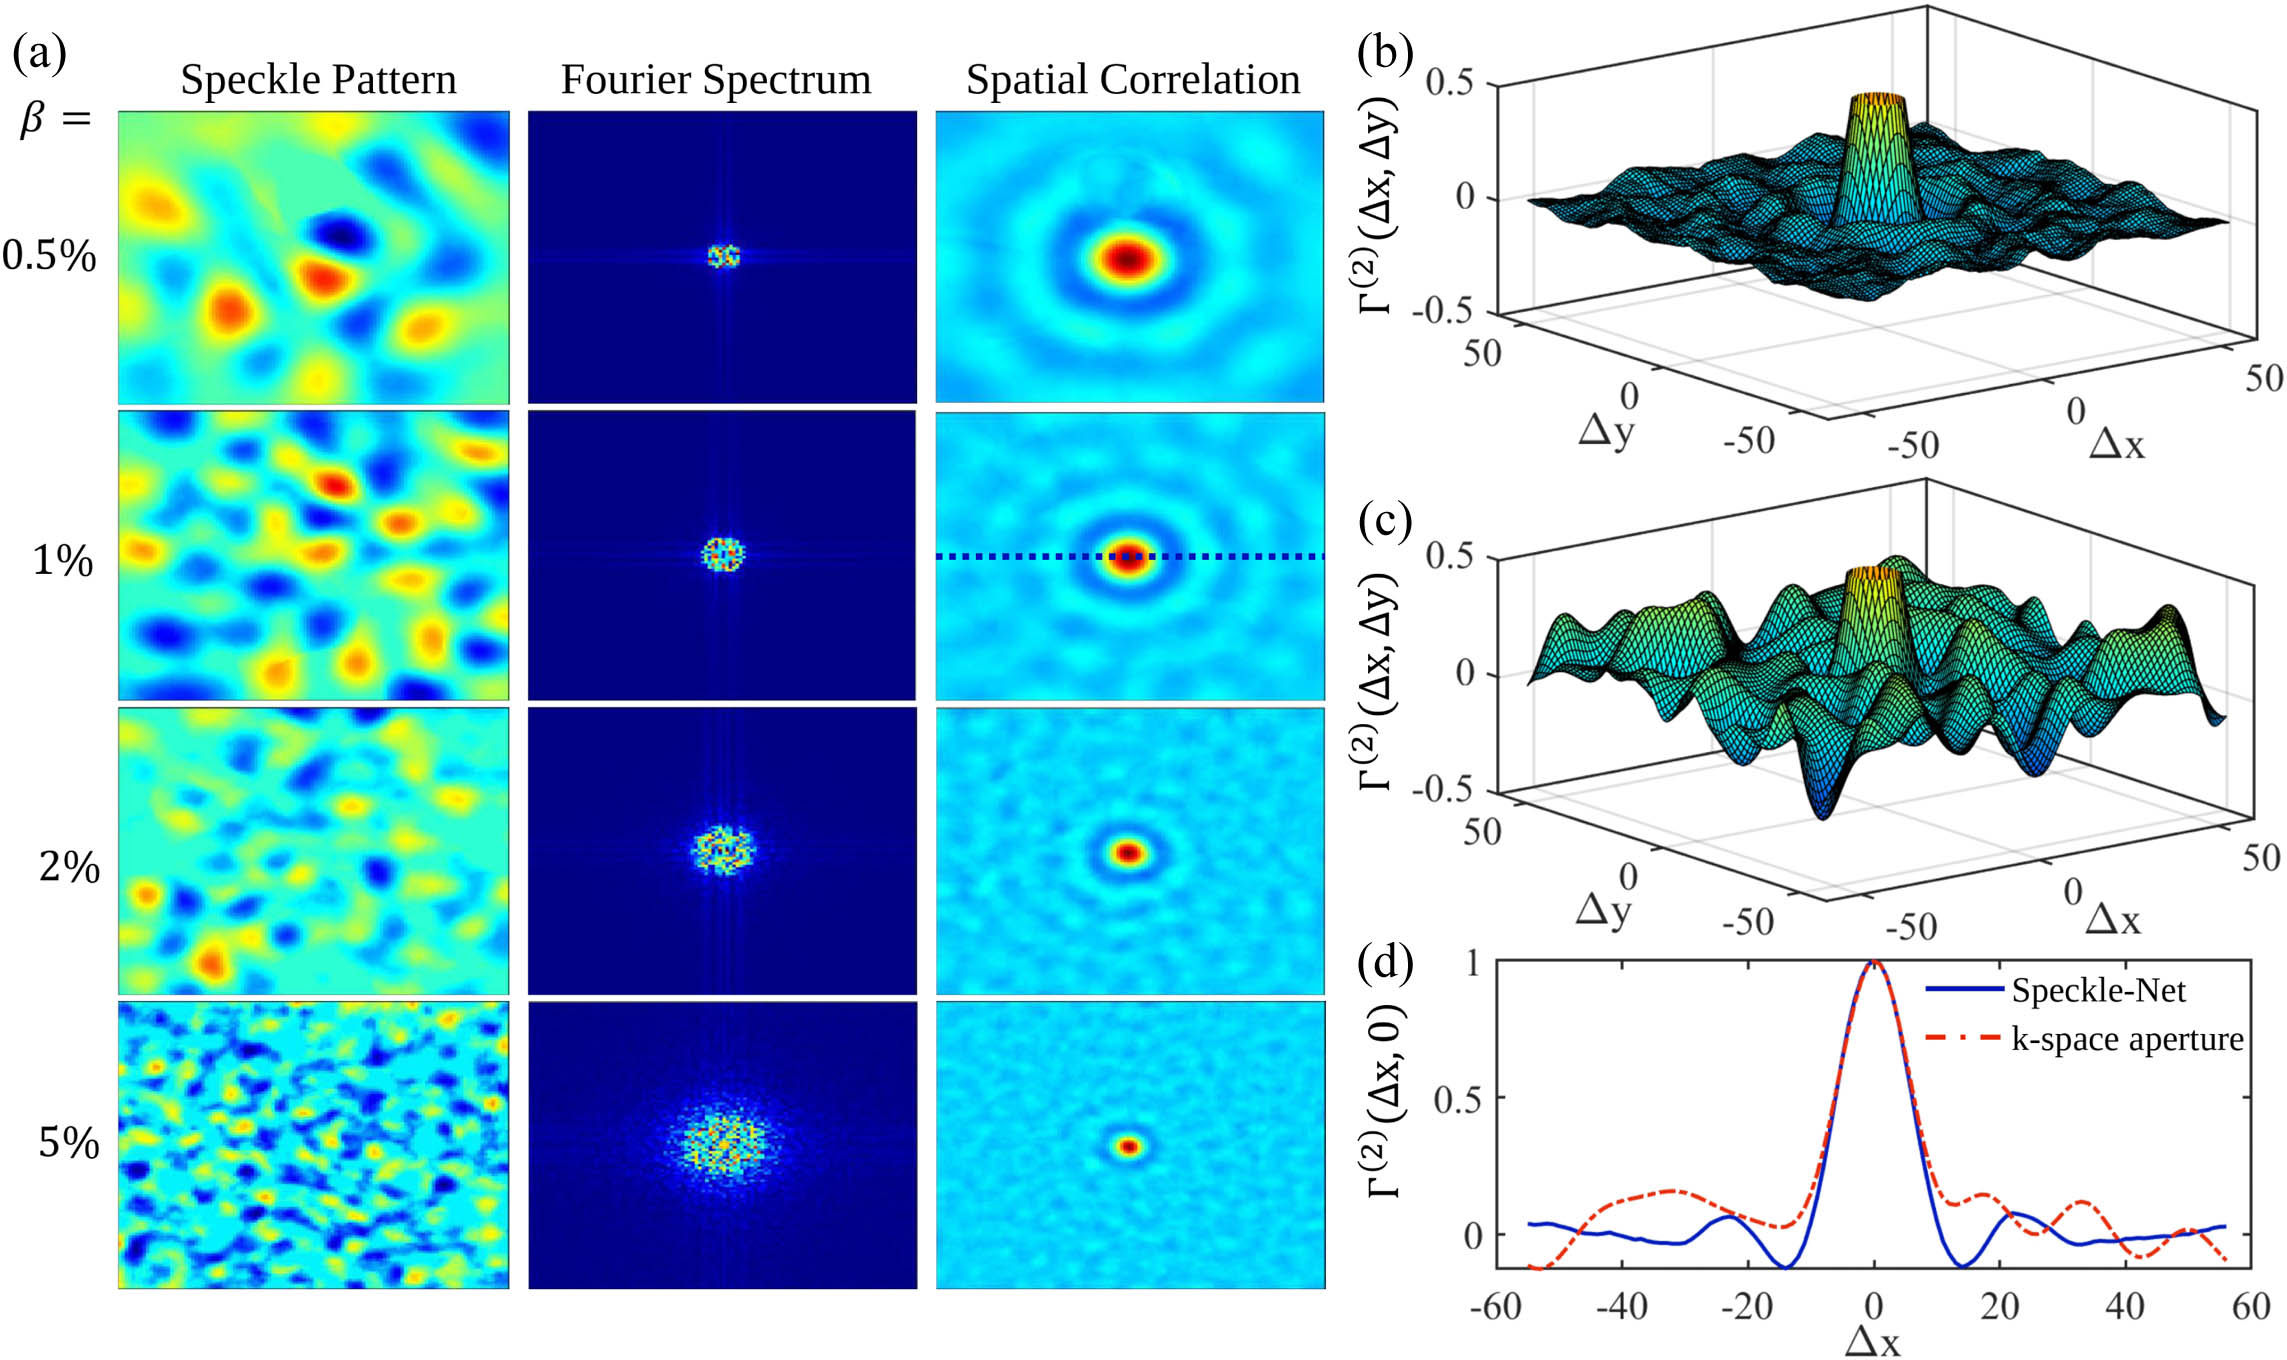
    Fig. 2. (a) Left column: speckle patterns after three-branch Speckle-Net training with β=5%,2%,1%, and 0.5%. Middle column: Fourier spectra of the corresponding patterns (frequency components fx and fy increase from the center to edges). Right column: spatial intensity correlation distributions (correlation distance increases from the center to edges). (b) Spatial correlations of patterns with Speckle-Net and β=1%. (c) Spatial correlations (β=1%) of patterns generated by the diffuser plate. A k-space aperture is applied at the Fourier plane of patterns to control the correlation width the same as in (b). (d) Comparison between two methods with 1D plot along the dashed line marked in (a).
    Experimental results of CGI with simple objects (“three lines,” π, digits “4” and “8”), English letters (“CGI,” “XJTU,” “CITY U,” and “TAMU”), Chinese characters (“xiàng,” “hŭo,” “yán,” and “yàn”), and pictures (“ghost,” “rabbit,” “leaf,” and “Tai Chi”) by speckle patterns given from three-branch Speckle-Net. From top to bottom: objects, CGI results with β=5%, 2%, 1%, 0.5% with deep correlated patterns, and β=5% using conventional white noise patterns, respectively.
    Fig. 3. Experimental results of CGI with simple objects (“three lines,” π, digits “4” and “8”), English letters (“CGI,” “XJTU,” “CITY U,” and “TAMU”), Chinese characters (“xiàng,” “hŭo,” “yán,” and “yàn”), and pictures (“ghost,” “rabbit,” “leaf,” and “Tai Chi”) by speckle patterns given from three-branch Speckle-Net. From top to bottom: objects, CGI results with β=5%,  2%,  1%,  0.5% with deep correlated patterns, and β=5% using conventional white noise patterns, respectively.
    Experimental results of CGI using deep correlated speckles with various noise levels labeled in the left column. (a) β=5%, (b) β=2%, (c) β=1%, and (d) β=0.5%.
    Fig. 4. Experimental results of CGI using deep correlated speckles with various noise levels labeled in the left column. (a) β=5%, (b) β=2%, (c) β=1%, and (d) β=0.5%.
    Spatial correlation of phase masks at the Fourier plane of (a) z=0R, (b) z=7.5R, (c) z=15R, and (d) z=45R. The result is ensemble averaged 10,000 times.
    Fig. 5. Spatial correlation of phase masks at the Fourier plane of (a) z=0R, (b) z=7.5R, (c) z=15R, and (d) z=45R. The result is ensemble averaged 10,000 times.
    Experimental results from the structured illumination microscope with deep correlated phase masks. (a) Speckle patterns captured by CCD with various propagation distances. (b) Contrast of speckle patterns corresponding to the propagation distance. The red dots are measurements of contrast of speckle patterns given by Speckle-Net phase masks, where each data point is repeated eight times with an errorbar. The solid blue line represents the contrast of super-Rayleigh speckle patterns starting with asymmetric random phase. The black dashed line shows the contrast of standard Rayleigh speckle patterns without the phase mask. Dashed gray line is a reference for C=1.
    Fig. 6. Experimental results from the structured illumination microscope with deep correlated phase masks. (a) Speckle patterns captured by CCD with various propagation distances. (b) Contrast of speckle patterns corresponding to the propagation distance. The red dots are measurements of contrast of speckle patterns given by Speckle-Net phase masks, where each data point is repeated eight times with an errorbar. The solid blue line represents the contrast of super-Rayleigh speckle patterns starting with asymmetric random phase. The black dashed line shows the contrast of standard Rayleigh speckle patterns without the phase mask. Dashed gray line is a reference for C=1.
    Probability density function in transverse planes. P(I) is the probability of intensity I (0–255) in its corresponding transverse plane. The dashed lines are seated on z=0R, z=7.5R, and z=45R.
    Fig. 7. Probability density function in transverse planes. P(I) is the probability of intensity I (0255) in its corresponding transverse plane. The dashed lines are seated on z=0R, z=7.5R, and z=45R.
    Xiaoyu Nie, Haotian Song, Wenhan Ren, Zhedong Zhang, Tao Peng, Marlan O. Scully. Deep correlated speckles: suppressing correlation fluctuation and optical diffraction[J]. Photonics Research, 2024, 12(4): 804
    Download Citation