• Infrared and Laser Engineering
  • Vol. 51, Issue 2, 20210909 (2022)
Zhijie Li1、2, Qingqing Kong1、2, Mingdong Zhang1、2, Ziheng Jing1、2, Yinxu Bian1、2, Hua Shen1、2, and Rihong Zhu1、2
Author Affiliations
  • 1School of Electronic and Optical Engineering, Nanjing University of Science and Technology, Nanjing 210094, China
  • 2MIIT Key Laboratory of Advanced Solid Laser , Nanjing University of Science and Technology, Nanjing 210094, China
  • show less
    DOI: 10.3788/IRLA20210909 Cite this Article
    Zhijie Li, Qingqing Kong, Mingdong Zhang, Ziheng Jing, Yinxu Bian, Hua Shen, Rihong Zhu. Analysis and treatment of thermal effects in 10 kW-level optic switch[J]. Infrared and Laser Engineering, 2022, 51(2): 20210909 Copy Citation Text show less
    Schematic diagram of coupling system
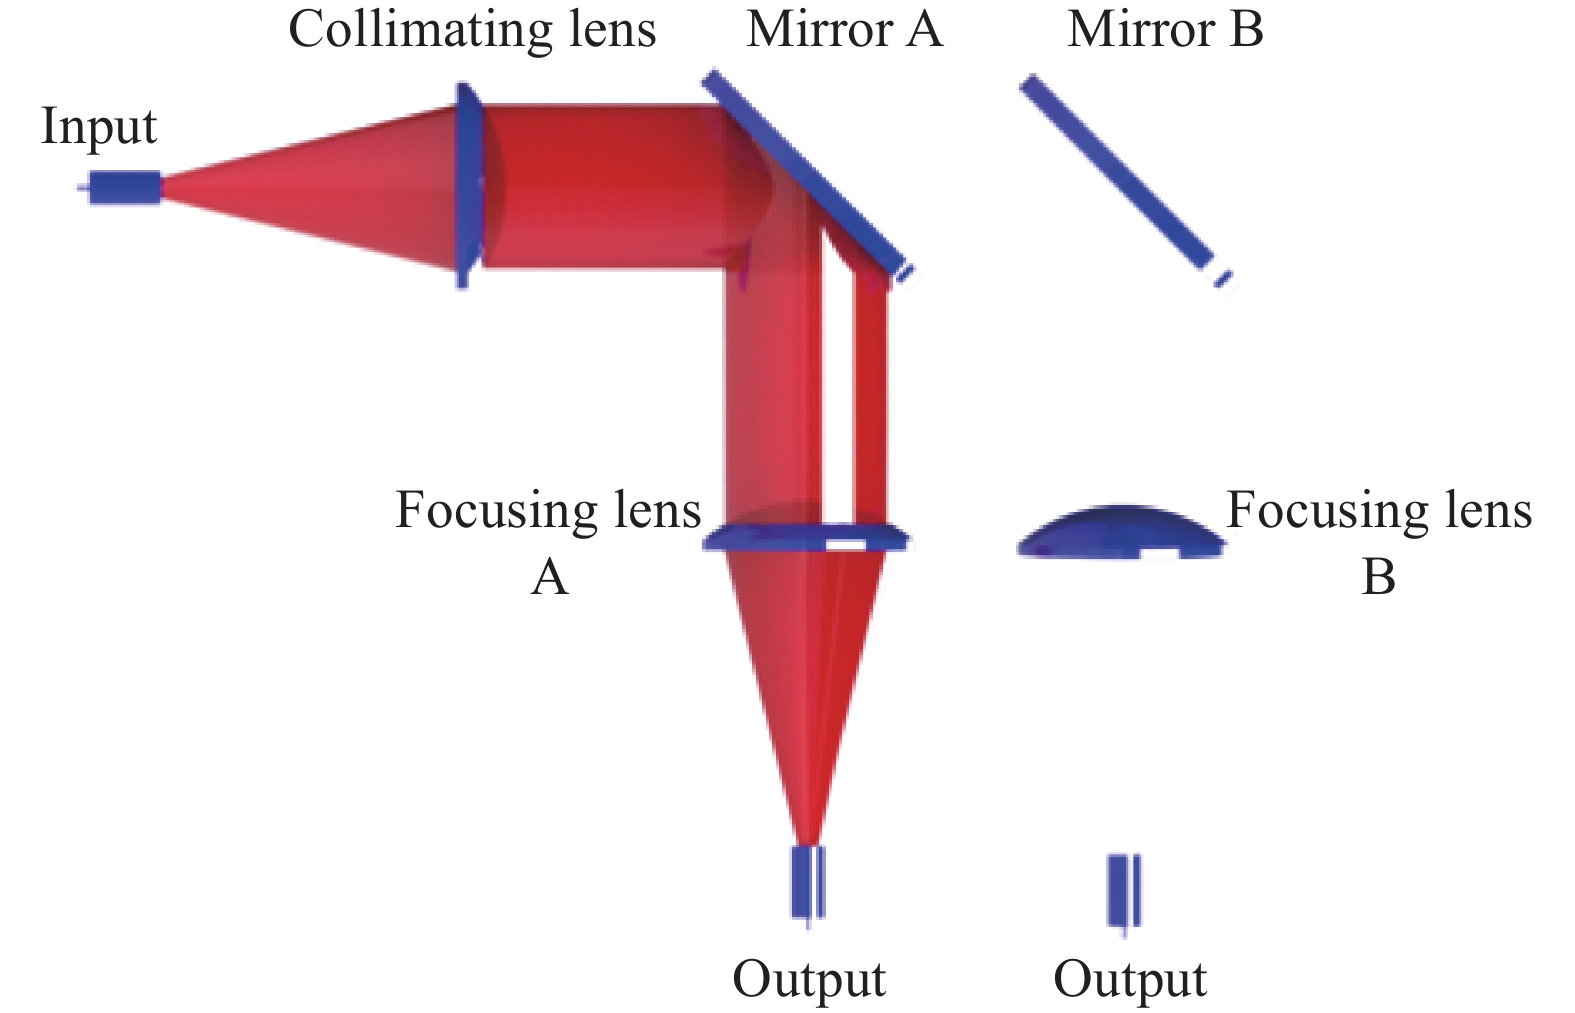
    Fig. 1. Schematic diagram of coupling system
    Schematic diagram of the optic switch coupling
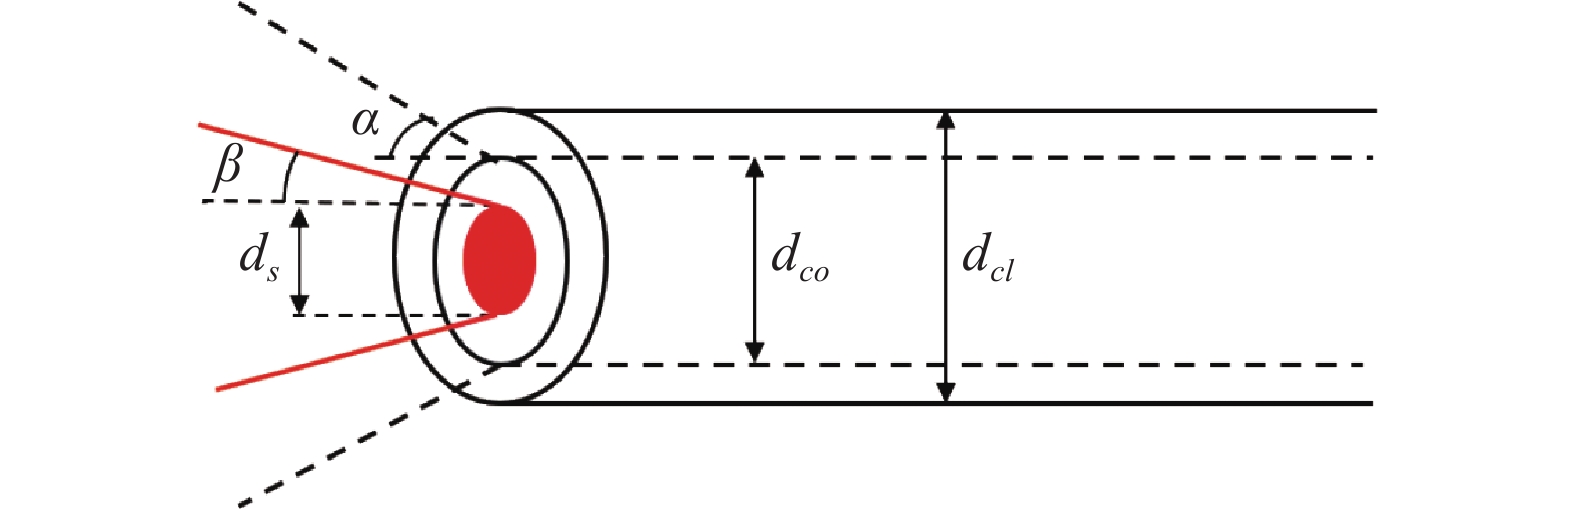
    Fig. 2. Schematic diagram of the optic switch coupling
    Optical path diagram of coupling system
    Fig. 3. Optical path diagram of coupling system
    System temperature distribution without water cooling: (a) Input power is 1 W; (b) Input power is 12 kW
    Fig. 4. System temperature distribution without water cooling: (a) Input power is 1 W; (b) Input power is 12 kW
    Curve of the maximum temperature rise of the lens and variation rate of focal spot radius with the input power without water cooling
    Fig. 5. Curve of the maximum temperature rise of the lens and variation rate of focal spot radius with the input power without water cooling
    Schematic diagram of circulating flow cooling method
    Fig. 6. Schematic diagram of circulating flow cooling method
    (a) Curve of maximum temperature rise of lens with input power under different water temperatures; (b) Curve of variation rate of focal spot radius with input power under different water temperatures
    Fig. 7. (a) Curve of maximum temperature rise of lens with input power under different water temperatures; (b) Curve of variation rate of focal spot radius with input power under different water temperatures
    (a) Curve of maximum temperature rise of lens with input power under different water velocities;(b) Curve of variation rate of focal spot radius with input power under different water velocities
    Fig. 8. (a) Curve of maximum temperature rise of lens with input power under different water velocities;(b) Curve of variation rate of focal spot radius with input power under different water velocities
    Curve of maximum temperature rise of the lens and variation rate of focal spot radius with the input power(The water temperature is 20 ℃, the water velocity is 0.01 m/s)
    Fig. 9. Curve of maximum temperature rise of the lens and variation rate of focal spot radius with the input power(The water temperature is 20 ℃, the water velocity is 0.01 m/s)
    (a) Physical device of the optic switch; (b) Schematic diagram of experiment
    Fig. 10. (a) Physical device of the optic switch; (b) Schematic diagram of experiment
    Diagram of experimental result of coupling efficiency test
    Fig. 11. Diagram of experimental result of coupling efficiency test
    Diagram of long-time stability test result of the optic switch
    Fig. 12. Diagram of long-time stability test result of the optic switch
    (a) BPP stability test result of output beam of optic switch;(b) Final quality test result of output beam of optic switch
    Fig. 13. (a) BPP stability test result of output beam of optic switch;(b) Final quality test result of output beam of optic switch
    Zhijie Li, Qingqing Kong, Mingdong Zhang, Ziheng Jing, Yinxu Bian, Hua Shen, Rihong Zhu. Analysis and treatment of thermal effects in 10 kW-level optic switch[J]. Infrared and Laser Engineering, 2022, 51(2): 20210909
    Download Citation