• Photonics Research
  • Vol. 11, Issue 6, 1094 (2023)
Yaqing Jin1、2, Ye Yang3、4、5, Huibo Hong1、2, Xiao Xiang1、2, Run'ai Quan1、2, Tao Liu1、2, Ninghua Zhu3、4、6, Ming Li3、4、6、7, Shougang Zhang1、2、8, and Ruifang Dong1、2、*
Author Affiliations
  • 1Key Laboratory of Time and Frequency Primary Standards, National Time Service Center, Chinese Academy of Sciences, Xi’an 710600, China
  • 2School of Astronomy and Space Science, University of Chinese Academy of Sciences, Beijing 100049, China
  • 3State Key Laboratory on Integrated Optoelectronics, Institute of Semiconductors, Chinese Academy of Sciences, Beijing 100083, China
  • 4School of Electronic, Electrical and Communication Engineering, University of Chinese Academy of Sciences, Beijing 100049, China
  • 5The 29th Research Institute of China Electronics Technology Group Corporation, Chengdu 610029, China
  • 6Center of Materials Science and Optoelectronics Engineering, University of Chinese Academy of Sciences, Beijing 100190, China
  • 7e-mail: ml@semi.ac.cn
  • 8e-mail: szhang@ntsc.ac.cn
  • show less
    DOI: 10.1364/PRJ.484142 Cite this Article Set citation alerts
    Yaqing Jin, Ye Yang, Huibo Hong, Xiao Xiang, Run'ai Quan, Tao Liu, Ninghua Zhu, Ming Li, Shougang Zhang, Ruifang Dong. Surpassing the classical limit of the microwave photonic frequency fading effect by quantum microwave photonics[J]. Photonics Research, 2023, 11(6): 1094 Copy Citation Text show less

    Abstract

    With energy–time entangled biphoton sources as the optical carrier and time-correlated single-photon detection for high-speed radio frequency (RF) signal recovery, the method of quantum microwave photonics (QMWP) has presented the unprecedented potential of nonlocal RF signal encoding and efficient RF signal distilling from the dispersion interference associated with ultrashort pulse carriers. In this paper, its capability in microwave signal processing and prospective superiority are further demonstrated. Both QMWP RF phase shifting and transversal filtering functionality, which are the fundamental building blocks of microwave signal processing, are realized. Besides good immunity to the dispersion-induced frequency fading effect associated with the broadband carrier in classical MWP, a native two-dimensional parallel microwave signal processor is provided. These results well demonstrate the superiority of QMWP over classical MWP and open the door to new application fields of MWP involving encrypted processing.

    1. INTRODUCTION

    Microwave photonics (MWP), which deals with the generation, processing, control, and distribution of high-speed radio frequency (RF) signals using photonic techniques [1], has attracted increasing interest, as it can achieve functions that are very complex or even not possible using purely electronic technology [27]. Its application has been widespread in numerous areas such as broadband wireless communication networks, radar [8], instrumentation, and sensor networks [9]. An MWP system should typically include a laser source as the optical carrier, an electro-optic modulator (EOM), an optical signal processor, and a photodetector (PD). The microwave or RF signal is first modulated onto the optical carrier by the EOM, and the modulated optical carrier is then processed by the optical signal processor. With the PD, the processed optical signal is detected for the RF signal recovery. However, for scenarios with ultra-low power and low signal-to-noise ratios, the current MWP systems cannot be applied. Furthermore, in various MWP applications using broadband sources as the optical carrier, the processed RF signal also suffers severe dispersion-induced frequency fading, which becomes a more and more important problem. Although the processing bandwidth of the optical technology can be as large as hundreds of THz, the bandwidth of the classical MWP system is ultimately limited by the utilized microwave devices for further processing [10,11].

    To break the above bottlenecks, the scheme of single-photon MWP (SP-MWP) was recently proposed [12]. Based on a superconducting nanowire SP detector (SNSPD) and a successive time-correlated SP counting (TCSPC) module, the SP-MWP signal processing system with phase shifting and frequency transversal filtering was demonstrated. An ultrahigh optical sensitivity down to 100  dBm has been achieved, and the signal processing bandwidth is limited only by the timing jitter of SP detectors [13,14], which can be as low as sub-3 ps [15]. Nonetheless, the dispersion-induced frequency fading associated with the carrier bandwidth still remains.

    The rapid growth of photonic quantum technology has promised enhancement to a vast range of fields including navigation and timing [1619], secure communications [2022], imaging and sensing [23,24], and quantum computing [25]. Recently, quantum MWP in radio-over-fiber (QMWP-RoF) systems has been demonstrated using an energy–time entangled biphoton source as the ultrashort optical pulse carrier combined with the SPD technique [26]. Due to the strong quantum temporal correlation between the energy–time entangled photon pairs [27,28], the QMWP provides the unprecedented capability of nonlocal RF modulation, which also realizes an improved spurious-free dynamic range (SFDR) and strong resistance to dispersion interference in RoF systems. Together with the advantages of ultra-weak detection and high-speed processing rendered by the SPD technique, the QMWP method offers a bright potential for exploring new possibilities in modern communication networks.

    In this paper, we present the first QMWP signal processing system to demonstrate its superior capability over classical MWP. Both functions of RF phase shifting and multi-tap transversal frequency filtering have been realized, which are the fundamental building blocks of microwave signal processing. In contrast to classical MWP, the significant dispersion-induced frequency fading associated with the carrier bandwidth can be eliminated, which thus overcomes the bandwidth limit in classical broadband MWP. As both entangled signal and idler photons can be employed as the optical carrier, a two-dimensional parallel microwave signal processor is naturally provided with each photon carrier taking independent phase shifting and transversal filtering characteristics. These demonstrations of QMWP signal processing well prove the superiority of QMWP over classical MWP and open the door to a new application field of MWP such as encrypted processing.

    2. PRINCIPLE AND EXPERIMENTAL SETUP

    A. Principle

    To illustrate the core principle involved in QMWP signal processing, a schematic diagram for realizing nonlocal RF signal mapping, phase shifting, and three-tap transversal filtering is shown in Fig. 1.

    Principle diagrams of the QMWP-based nonlocal RF phase shifter and transversal filter. (a) Illustration of nonlocal spectral mapping based on the joint spectrum of frequency anti-correlated photon pairs. Because of the strong frequency anti-correlation, the spectral slicing on the signal photons will be nonlocally mapped onto the idler photons. By adjusting the passband channel of the signal photons, the corresponding passband channel of the idler photons is changed in the opposite direction. (b) Joint temporal distribution profile of the spectrally sliced photon pairs. Due to the strong temporal correlation, the intensity modulation on the idler photons will be nonlocally transferred to the signal photons. (c) Visualized evolution of the temporal correlation distribution and modulation when a dispersive element is applied to the idler photon, which is dispersed in both width and offset. When modulation is applied, the phase shift due to dispersion-induced offset will result. (d) Nonlocal mapping on the idler photons when the optical slicer with multiple passbands is applied. (e) Visualized evolution of the temporal correlation distribution and modulation with the multi-passband slicer on the signal photons and dispersion on the idler photons. (f) Visualized evolution of the temporal correlation distribution and modulation with dispersion applied to the signal photons.

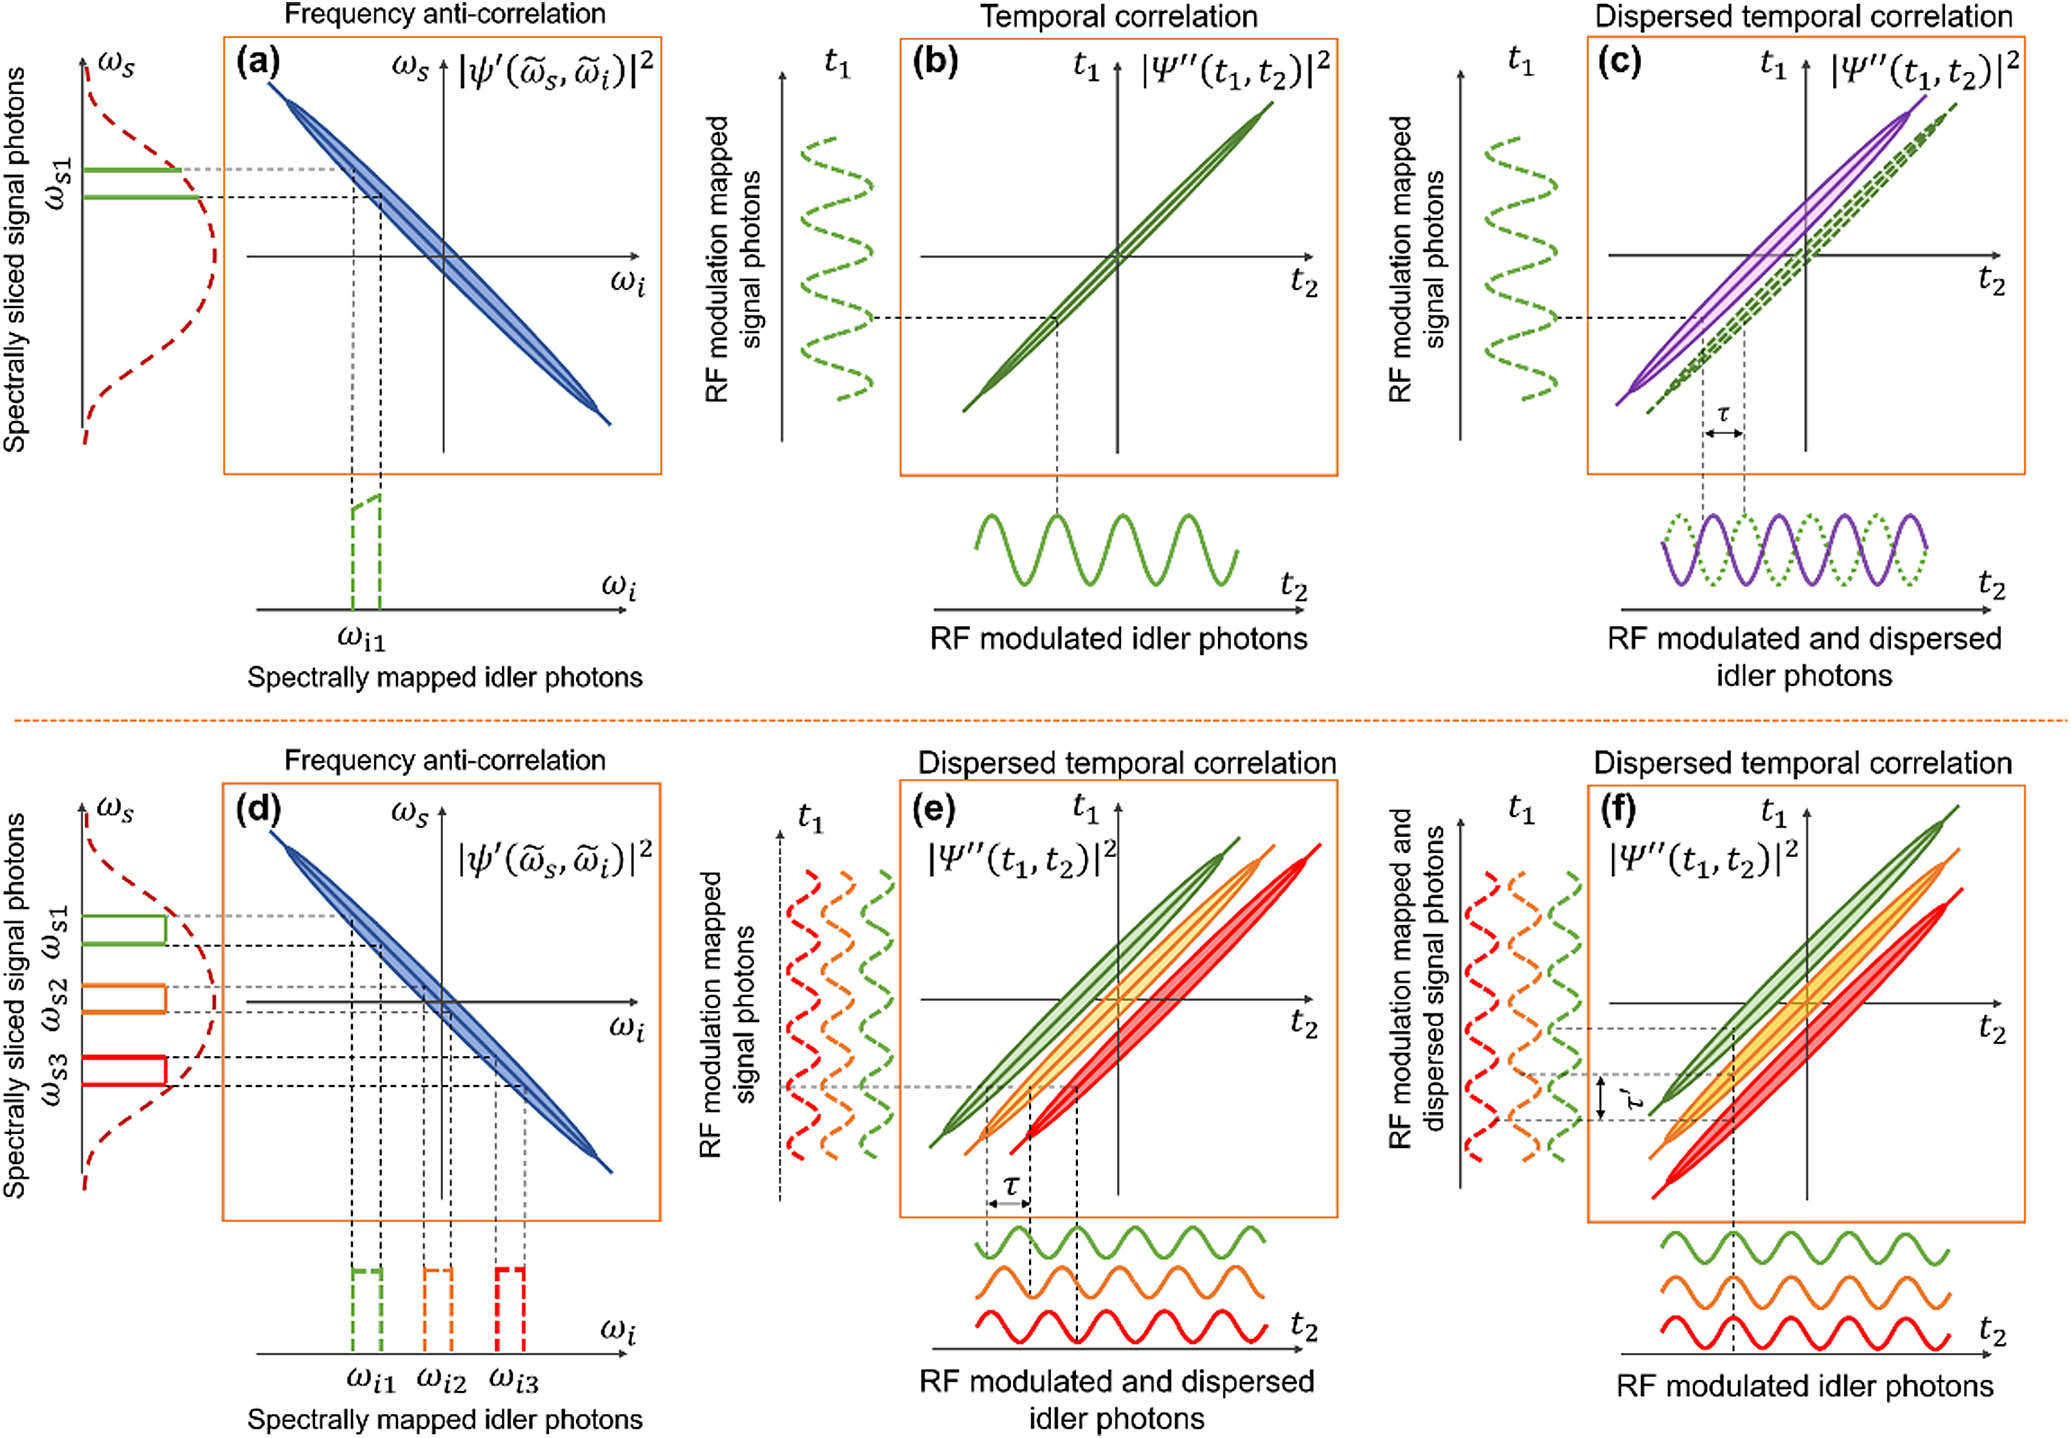
    Figure 1.Principle diagrams of the QMWP-based nonlocal RF phase shifter and transversal filter. (a) Illustration of nonlocal spectral mapping based on the joint spectrum of frequency anti-correlated photon pairs. Because of the strong frequency anti-correlation, the spectral slicing on the signal photons will be nonlocally mapped onto the idler photons. By adjusting the passband channel of the signal photons, the corresponding passband channel of the idler photons is changed in the opposite direction. (b) Joint temporal distribution profile of the spectrally sliced photon pairs. Due to the strong temporal correlation, the intensity modulation on the idler photons will be nonlocally transferred to the signal photons. (c) Visualized evolution of the temporal correlation distribution and modulation when a dispersive element is applied to the idler photon, which is dispersed in both width and offset. When modulation is applied, the phase shift due to dispersion-induced offset will result. (d) Nonlocal mapping on the idler photons when the optical slicer with multiple passbands is applied. (e) Visualized evolution of the temporal correlation distribution and modulation with the multi-passband slicer on the signal photons and dispersion on the idler photons. (f) Visualized evolution of the temporal correlation distribution and modulation with dispersion applied to the signal photons.

    Energy–time entanglement refers to the signal and idler photons having the quantum properties of frequency anti-correlation and temporal correlation. When CW pumped spontaneous parametric down conversion (SPDC) is utilized to generate the two-photon state, its spectral wave function can be given by ψ(ω˜s,ω˜i)δ(ω˜s+ω˜i)sinc[(γsω˜s+γiω˜i)L2],where ω˜s(i)=ωs/iωs/i,0 is the angular frequency detuning of the signal (idler) photon from its center angular frequency ωs(i),0; γs(i) is the phase matching parameter; and L is the length of the SPDC crystal [29]. From Eq. (1), it is clearly seen that the signal and idler photons are frequency anti-correlated. A schematic diagram of the joint spectrum of frequency anti-correlated photon pairs is shown in Fig. 1(a). The sinc function is the crystal’s phase-matching function, whose bandwidth denotes the SP spectral bandwidth. When an optical slicer at ω˜F with a spectral bandwidth of σF is applied to SPs, which can be described by H(ω˜s)e(ω˜sω˜F)2/(2σF2), the two-photon spectral wave function is transferred to ψ(ω˜s,ω˜i)δ(ω˜s+ω˜i)sinc[(γsω˜s+γiω˜i)L2]e(ω˜sω˜F)22σF2.

    When σF is far narrower than the crystal’s phase-matching bandwidth, the two-photon spectral wave function can be reduced to ψ(ω˜s,ω˜i)δ(ω˜s+ω˜i)e(ω˜sω˜F)22σF2.

    Under such condition, the spectral wave function of the idler photons can be deduced as ϱc(ω˜i)=dω˜sψ(ω˜s,ω˜i)e(ω˜i+ω˜F)22σF2.

    Therefore, as depicted in Fig. 1(a), the spectral slicing of SPs at ω˜F is nonlocally mapped onto the idler photons at ω˜F.

    The two-photon temporal wave function can be deduced from the Fourier transformation of Eq. (3): Ψ(t1,t2)eσF22(t1t2)2iω˜F(t1t2),where t1 and t2 represent the temporal coordinates of signal and idler photons, respectively. It is clearly seen that the spectrally sliced photon pairs are temporally correlated, and their joint temporal distribution is sketched in Fig. 1(b). When the RF signal with ωRF is intensity modulated onto the idler photons, whose transfer function is given by M(t2)=1+cos(ωRFt2), the temporal waveforms of idler photons conditioned on temporal correlation can be deduced as ρc(t2)=dt1Ψ(t1,t2)M(t2)eω˜F22σF2[1+cos(ωRFt2)].

    Without loss of generality, the global term of eω˜F2/2σF2 is neglected in the following deduction. Thus, the temporal waveform of the conditioned idler photons can be rewritten as ρc(t2)1+cos(ωRFt2). Likewise, the temporal waveforms of the conditioned SPs can be deduced as ρc(t1)=dt2Ψ(t1,t2)M(t2)1+12eω˜F22σF2[e(ω˜FωRF)22σF2eiωRFt1+e(ω˜F+ωRF)22σF2eiωRFt1].

    For ω˜FωRF, Eq. (7) can be approximated as ρc(t1)1+cos(ωRFt1), which takes the same form as Eq. (6). Thus, RF modulation on the idler photons is nonlocally transferred onto SPs based on photon conditioning. The temporal modulation and mapping are also plotted in Fig. 1(b).

    For the implementation of nonlocal RF phase shifting, a dispersive element with a dispersion parameter of D should be input into the setup. Considering that it is on the idler photon path, the corresponding transfer function can be given by HD(t2)=exp[i(t222D+t2ω˜F)]. Without involving RF modulation, the resultant two-photon temporal wave function can be given by Ψ(t1,t2)dτΨ(t1,τ)HD(τt2)exp[i(t1t2)2σF22iDω˜FσF2(t1+t2)+D2ω˜F2+2ω˜Ft2i+2DσF2],whose square module is then deduced as |Ψ(t1,t2)|2e(t1t2Dω˜F)21/σF2+D2σF2.

    It can be seen that the dispersion D will introduce a center shift dependent on the slicing frequency (τ=ω˜FD) of temporal correlation distribution besides width broadening, whose profile is also shown in Fig. 1(c) by the purple shape. With RF modulation on the idler photons before dispersion, the temporal waveform of the idler photons conditioned on temporal correlation can be deduced as ρc(t2)=dt1dτΨ(t1,τ)M(τ)HD(τt2)dt1eiω˜F(t1t2)eiσ2(t1t2)22+2σ2D{1+12[eiωRFt1eωRF(t1t2ωRFD/2)i+σ2D+eiωRFt1eωRF(t1t2+ωRFD/2)i+σ2D]}1+eiDωRF2/2cos[ωRF(t2Dω˜F)].

    It can be seen that the conditioned idler photon waveform experiences a phase shift of φ=ωRFτ=ωRFω˜FD. The term eiDωRF2/2 represents the microwave frequency-dependent fading, which is analogous to classical MWP technology. However, the fading associated with the carrier bandwidth in classical MWP has no influence at all. The corresponding temporal waveform of SPs conditioned on temporal correlation can also be deduced, which is given by ρc(t1)=dt2dτΨ(t1,τ)M(τ)HD(τt2)1+12eω˜F22σF2[e(ω˜FωRF)22σF2eiωRFt1+e(ω˜F+ωRF)22σF2eiωRFt1].

    It can be seen that Eq. (11) takes the same form as Eq. (7). Therefore, the nonlocally mapped RF modulation on SPs will not be affected by dispersion in either phase shift or fading [26]. The expected phase shifting performances for both signal and idler photon waveforms are plotted in Fig. 1(c). Note should be taken that when a dispersive element of D is inserted into the signal path, the results should be vice versa. That is, the conditioned signal photon waveform should experience a phase shift of φ=ωRFω˜FD and a fading determined by the term eiDωRF2/2.

    When a multi-channel optical slicing with identical spectral gap of Δω˜ and spectral bandwidth of σF is applied onto SPs, the transfer function can be given by H(ω˜s)kexp[(ω˜sω˜F,0kΔω˜)2/(2σF2)]. Due to the frequency anti-correlation between signal and idler photons, the spectral slicings are nonlocally mapped onto the idler photons as shown in Fig. 1(d). Similar to the deductions from Eqs. (3)–(11), the temporal waveform expression of the idler photons conditioned on temporal correlation can be given by ρc(t2)1+eiDωRF2/2kcos{ωRF[t1D(ω˜F,0+kΔω˜)]}.

    As each spectrally sliced idler photon would experience a different phase shifting linearly dependent on dispersion as shown in Fig. 1(e), the acquired photon waveforms are determined by the function kcos{ωRF[t2D(ω˜F,0+kΔω˜)]}, which then results in the multi-tap transversal frequency filter with the free-spectral range (FSR) determined by Δω˜D. In comparison with classical MWP, no fading associated with the carrier bandwidth contributes. Likewise, with another dispersive element with dispersion of D simultaneously inserted into the signal photon path as shown in Fig. 1(f), the acquired photon waveform from the signal photon flow should follow ρc(t1)1+12eiDωRF2/2ke(ω˜F,0+kΔω˜)22σF2[e(ω˜F,0+kΔω˜ωRF)22σF2eiωRF(t1+Dω˜F)+e(ω˜F,0+kΔω˜+ωRF)22σF2eiωRF(t1+Dω˜F)]ω˜F,0+kΔω˜ωRFρc(t1)1+eiDωRF2/2kcos{ωRF[t1+D(ω˜F,0+kΔω˜)]}.

    Thus, a second multi-tap frequency filter can be realized from the signal photon output with a different FSR determined by Δω˜D. Note that in practical experiments, spectral slicing is defined in the wavelength domain. By transforming ω˜F into the wavelength deviation (δλF) from the degenerate wavelength (λ0) and the dispersion D into group delay dispersion (GDD), the time delay can be rewritten as τδλF·GDD. Accordingly, the FSR should be given by FSR1/(Δλ·GDD), where Δλ corresponds to the wavelength gap between adjacent spectral slices.

    B. Experimental Setup

    The experimental setup of the QMWP signal processing system is shown in Fig. 2. The frequency anti-correlated and temporally correlated photon pairs are generated from a piece of 10 mm long, type-II periodically poled lithium niobate (PPLN) waveguide (HC Photonics) pumped by a CW distributed Bragg reflector (DBR) laser (Photodigm) at 780 nm, whose spectral bandwidth in FWHM was measured as 0.0025 nm [30]. After filtering out the residual pump beam, the orthogonally polarized signal and idler photons, marked with s and i, are spatially separated by a fiber polarization beam splitter (FPBS). The FWHM SP spectral widths for both signal and idler photons were measured as about 2.42 nm [30]. To implement the optical slicing, a programmable waveshaper (WaveShaper 16000A, Finisar) is placed in the signal path. For the QMWP phase shifting [Fig. 2(b)] demonstration, the shaper is set to have a single passband with a tunable central wavelength. For QMWP three-tap transversal filtering [Fig. 2(c)], the shaper is set to have three passbands with a uniform bandgap and tunable attenuation. In the idler path, the photon flux is intensity modulated by a Mach–Zehnder modulator (MZM, PowerBitTM F10-0, Oclaro), through which the high-speed RF signal from a signal generator (E8257D, Keysight) is loaded onto the idler photons. Then the modulated idler photons are fed into a fiber-Bragg-grating-based dispersion compensation module (DCM, Proximion AB) for realizing dispersion-induced phase shifting. In the experiment, different DCMs with GDD values ranging from 165 ps/nm to 495 ps/nm (at 1545 nm) are applied. Afterward, the processed signal and idler photons are respectively detected by low-jitter SNSPD1 and SNSPD2 (Photec) with the time jitter of about 50 ps [31]. The two SNSPD outputs are then delivered to different input ports (CH1 and CH2) of the TCSPC module (PicoQuant Hydraharp 400), which is operated in the time-tagged time-resolved (TTTR) T3 mode with its time-bin resolution set as 8 ps. In T3 mode, the TCSPC records the arrival times of photon events for each input port and sync event for the “SYNC” port. For satisfactory acquisition of the reconstructed photon waveform, the minimum measurement time for photon event recording is set at 300 s. To provide phase stabilization between the RF signal and sync signal, a common time base is needed. In our experiment, the 10 MHz time base from the E8257D signal generator is shared between the RF and sync signals. Based on the coincidence measurements (see Appendix A), the entangled photon pairs are post-selected and utilized to rebuild the waveforms processed by the QMWP method [26].

    Experimental setup of the QMWP RF frequency phase shifter and filter. (a) The photon pairs are from the SPDC process. The signal photon is optically sliced by a programmable wave shaper, while the idler photon is modulated and dispersed. Afterwards, the signal and idler photons are detected by a multichannel SNSPD and a TCSPC for recording their time of arrival. By applying the cross-correlation searching algorithm, the paired signal and idler photons are selected out and utilized to reconstruct the photon waveforms. (b) Graphics of the idler photon waveforms when the wavelength channel of the single-passband optical slice is increased, which shows the QMWP functionality of RF phase shifting. (c) Graphics of the idler photon waveforms when the three passbands of the optical slicer take different ratios, which illustrate the QMWP functionality of a three-tap filter with different sidelobe suppression ratios.

    Figure 2.Experimental setup of the QMWP RF frequency phase shifter and filter. (a) The photon pairs are from the SPDC process. The signal photon is optically sliced by a programmable wave shaper, while the idler photon is modulated and dispersed. Afterwards, the signal and idler photons are detected by a multichannel SNSPD and a TCSPC for recording their time of arrival. By applying the cross-correlation searching algorithm, the paired signal and idler photons are selected out and utilized to reconstruct the photon waveforms. (b) Graphics of the idler photon waveforms when the wavelength channel of the single-passband optical slice is increased, which shows the QMWP functionality of RF phase shifting. (c) Graphics of the idler photon waveforms when the three passbands of the optical slicer take different ratios, which illustrate the QMWP functionality of a three-tap filter with different sidelobe suppression ratios.

    3. RESULTS AND DISCUSSION

    A. QMWP-Based RF Signal Phase Shifting Performance

    Nonlocal RF signal phase shifting on the idler photons is first investigated based on the setup. The waveshaper is set in the single-passband mode, with its FWHM bandwidth being 0.30 nm and center wavelength tuned from 1560.20 nm to 1561.10 nm with a step of 0.30 nm. When the RF signal is 3 GHz and the DCM in the idler path is chosen to have a GDD of 165 ps/nm, the reconstructed waveforms for the signal (red dots) and idler (blue squares) photons at the four successive wavelengths are plotted in the four subfigures of Fig. 3(a). It can be seen that the waveforms of non-dispersed SPs do not vary with the wavelength adjustment, while the waveforms of dispersed idler photons experience a left-hand shift with the increase of wavelength. With the DCM moved to the signal path, similar measurements are also made and plotted in Fig. 3(b). By contrast, the idler photon waveforms do not vary with the wavelength while the waveforms from SPs experience a right-hand shift. By extracting the relative phase difference between the idler and signal photon waveforms over wavelength, the system’s phase shifting performance can be evaluated and is depicted in Fig. 3(c). From the linear fittings to the phase differences, which give slopes of 3.27±0.07  rad/nm and 3.31±0.03  rad/nm, respectively, simulated GDD values of 173.48±3.71  ps/nm and 175.60±1.59  ps/nm, respectively, show good agreement with each other as well as with the nominal value. For better verification, further tests are applied with a lager GDD of 330 ps/nm [Fig. 3(d)] or higher RF signal of 5 GHz [Fig. 3(e)]. Good agreement with the theoretical expectation is also achieved for the two cases, indicating that the QMWP system can well perform high-speed RF phase shifting.

    Results of QMWP-based RF signal phase shifting. (a) Reconstructed temporal waveforms of the signal (red dots) and idler photons (blue squares) when the DCM with a GDD of 165 ps/nm is placed in the idler path and a 3 GHz RF signal is applied. With the adjustment of the central wavelength of the tunable filter, the waveform of the signal photon remains unchanged, while the waveform of the idler photon is left-hand shifted. (b) Reconstructed temporal waveforms of the signal and idler photons when the DCM moves to the signal path while all other settings are maintained. In this case, the waveform of the signal photon is right-hand shifted, while the waveform of the idler photon remains unchanged. (c) Extracted relative phase differences over wavelength between the idler and signal photons’ waveforms in (a) and (b), respectively. The slopes of the linear fits are 3.27±0.07 rad/nm and 3.31±0.03 rad/nm, respectively. According to the direct dependence on the product of ωRF and GDD, the measured GDDs are 173.48±3.71 ps/nm and 175.60±1.59 ps/nm, respectively, which are in good agreement and close to the nominal value of 165 ps/nm GDD. (d), (e) Phase shifting performance when the GDD of the DCM is changed to 330 ps/nm or the RF is set to 5 GHz, respectively. The measured GDDs in (d) and (e) are respectively 346.43±2.23 ps/nm, 349.61±2.86 ps/nm and 172.52±4.77 ps/nm, 175.39±4.24 ps/nm, indicating good agreement with nominal GDD values of the DCMs.

    Figure 3.Results of QMWP-based RF signal phase shifting. (a) Reconstructed temporal waveforms of the signal (red dots) and idler photons (blue squares) when the DCM with a GDD of 165 ps/nm is placed in the idler path and a 3 GHz RF signal is applied. With the adjustment of the central wavelength of the tunable filter, the waveform of the signal photon remains unchanged, while the waveform of the idler photon is left-hand shifted. (b) Reconstructed temporal waveforms of the signal and idler photons when the DCM moves to the signal path while all other settings are maintained. In this case, the waveform of the signal photon is right-hand shifted, while the waveform of the idler photon remains unchanged. (c) Extracted relative phase differences over wavelength between the idler and signal photons’ waveforms in (a) and (b), respectively. The slopes of the linear fits are 3.27±0.07  rad/nm and 3.31±0.03  rad/nm, respectively. According to the direct dependence on the product of ωRF and GDD, the measured GDDs are 173.48±3.71  ps/nm and 175.60±1.59  ps/nm, respectively, which are in good agreement and close to the nominal value of 165 ps/nm GDD. (d), (e) Phase shifting performance when the GDD of the DCM is changed to 330 ps/nm or the RF is set to 5 GHz, respectively. The measured GDDs in (d) and (e) are respectively 346.43±2.23  ps/nm, 349.61±2.86  ps/nm and 172.52±4.77  ps/nm, 175.39±4.24  ps/nm, indicating good agreement with nominal GDD values of the DCMs.

    B. QMWP-Based RF Transversal Filtering Performance

    1. Comparison between the QMWP Method and SP-MWP Method

    As pointed out in Section 2, the QMWP-based RF transversal filtering performance can be realized when the optical slicer has multiple wavelength passbands with a uniform bandgap. By setting the passbands to three with their center wavelengths at 1560.95 nm, 1561.75 nm, and 1562.55 nm and each having an FWHM bandwidth of 0.3 nm, the three-tap transversal filtering performance in the QMWP configuration is tested. The power ratio of the three passbands can be flexibly adjusted. By adjusting the power ratio as 1:1:1, the three passbands with the same output power are utilized as the subsequent optical carrier. With the help of the MZM, the RF signal with a modulation power of 10 dBm and an adjustable frequency from 200 MHz to 8 GHz can be uploaded on the three optical carriers. Based on the post-selected idler photon counts, the reconstructed waveforms over time with respect to the two cases with and without the DCM in the setup are measured. For the two DCM cases with GDDs of 330 ps/nm and 495 ps/nm, the amplitude ratios of the waveform with dispersion to that without dispersion as a function of the RF from 200 MHz to 8 GHz are investigated (see Appendix B) and plotted in Figs. 4(a) and 4(b) by orange diamonds. Both show a nice-shaped notch filtering pattern with FSRs of 3.5 GHz and 2.35 GHz, respectively. Taking the dispersion-induced frequency fading effect without carrier bandwidth contribution (solid yellow curves) into consideration, the simulations of the filtering performances for both cases are given by the solid blue curve, which shows good agreement with the results.

    Comparison between QMWP and SP-MWP RF filtering. Experimentally acquired three-tap filtering responses in the configurations of QMWP: (a) 330 ps/nm and (b) 495 ps/nm; and SP-MWP: (c) 330 ps/nm and (d) 495 ps/nm. The three-tap RF filtering performance is tested by programming the waveshaper to have three passbands, whose center wavelengths are 1560.95 nm, 1561.75 nm, and 1562.55 nm, and each has an FWHM bandwidth of 0.3 nm. The solid yellow curve depicts the dispersion-induced frequency fading effect without carrier bandwidth contribution, and the solid pink curves in (c) and (d) involve the dispersion-induced frequency fading effect associated with the carrier bandwidth (0.3 nm in our case).

    Figure 4.Comparison between QMWP and SP-MWP RF filtering. Experimentally acquired three-tap filtering responses in the configurations of QMWP: (a) 330 ps/nm and (b) 495 ps/nm; and SP-MWP: (c) 330 ps/nm and (d) 495 ps/nm. The three-tap RF filtering performance is tested by programming the waveshaper to have three passbands, whose center wavelengths are 1560.95 nm, 1561.75 nm, and 1562.55 nm, and each has an FWHM bandwidth of 0.3 nm. The solid yellow curve depicts the dispersion-induced frequency fading effect without carrier bandwidth contribution, and the solid pink curves in (c) and (d) involve the dispersion-induced frequency fading effect associated with the carrier bandwidth (0.3 nm in our case).

    To reveal the superiority of the QMWP method for realizing RF filtering, three-tap RF filtering based on the SP-MWP method is also implemented by arranging all the above-mentioned elements of wave shaping, MZM, and DCM in the idler photon path. At RFs in the range of 200 MHz to 8 GHz, the TCSPC-recovered photon waveforms over time from the detected i path photon events are measured with respect to the two cases with and without the DCM in the setup. Regarding the above two DCM cases, the amplitude ratios of the waveforms with dispersion to that without dispersion as a function of the RF from 200 MHz to 8 GHz are also plotted in Figs. 4(c) and 4(d) by purple diamonds. As can be seen, the ratio decrements with the increasing RF are much faster than the dispersion-induced frequency fading without carrier bandwidth contribution (solid yellow curves) and should be due to the carrier-bandwidth-associated power fading. By taking the 0.3 nm bandwidth of the carriers into account (solid pink curves), a good fitting can be found between the simulations (solid gray curves) and results (purple diamonds) in Figs. 4(c) and 4(d). The results demonstrate that the frequency transversal filtering based on the SP-MWP method, whose performance is equivalent to classic MWP with a broadband optical carrier, is easily affected by the dispersion-induced fading associated with carrier bandwidth. Although larger dispersion would lead to a narrower filtering bandwidth, it would also result in worse fading. On the contrary, the QMWP-based RF transversal filtering performance [as shown by Figs. 4(a) and 4(b)] demonstrates good immunity to the fading associated with the carrier bandwidth.

    2. Reconfigurability of the Three-Tap RF Filter Based on the QMWP Method

    In addition to dispersion immunity, the QMWP transversal filter inherits excellent tunability in both FSR (see Appendix C) and sidelobe suppression. The sidelobe suppression capability of the three-tap RF filter is evaluated by measuring the main to sidelobe ratio (MSLR). The three passbands of the waveshaper are maintained at center wavelengths of 1560.95 nm, 1561.75 nm, and 1562.55 nm. Reconfigurable sidelobe suppression of the three-tap RF-filter is investigated and depicted in Fig. 5 with a GDD of 330 ps/nm, while the three passbands’ photon flux ratios are taken as 0.76:1:0.76, 0.65:1:0.65, and 0.60:1:0.60, which give MSLRs of 6.48 dB, 8.80 dB, and 10.66 dB, respectively. Together with the result shown in Fig. 4(a), which gives an MSLR of 4.67 dB, it is clearly manifested that the MSLR can be improved by decreasing the photon flux ratio of the sideband channels to the center channel. The dependence of the MSLR on the flux ratio is then plotted in Fig. 5(d) by orange dots, and the simulation based on classical MWP theory is also given by the solid blue curve. The excellent agreement with the experimental results demonstrates that the filtering in the QMWP follows the same filtering performance as classical MWP method.

    Reconfigurability of the three-tap QMWP RF filter. The three passbands of the waveshaper are maintained at center wavelengths of 1560.95 nm, 1561.75 nm, and 1562.55 nm. Reconfigurable sidelobe suppression of the three-tap RF filter is investigated via the filtering responses with a GDD of 330 ps/nm, while the three passbands’ photon flux ratios are taken as (a) 0.76:1:0.76, (b) 0.65:1:0.65, and (c) 0.60:1:0.60, which correspond to sidelobe suppression ratios of (a) 6.48 dB, (b) 8.80 dB, and (c) 10.66 dB, respectively. (d) Comparison between the measured MSLR of QMWP nonlocal filtering and the simulation of classic MWP filtering.

    Figure 5.Reconfigurability of the three-tap QMWP RF filter. The three passbands of the waveshaper are maintained at center wavelengths of 1560.95 nm, 1561.75 nm, and 1562.55 nm. Reconfigurable sidelobe suppression of the three-tap RF filter is investigated via the filtering responses with a GDD of 330 ps/nm, while the three passbands’ photon flux ratios are taken as (a) 0.76:1:0.76, (b) 0.65:1:0.65, and (c) 0.60:1:0.60, which correspond to sidelobe suppression ratios of (a) 6.48 dB, (b) 8.80 dB, and (c) 10.66 dB, respectively. (d) Comparison between the measured MSLR of QMWP nonlocal filtering and the simulation of classic MWP filtering.

    3. Parallel RF Transversal Filtering with Two-Dimensional Outputs

    As already noted, though the above demonstrations are implemented with the DCM in the idler path, the equivalent QMWP signal processing performance should be expected when the DCM is moved to the signal path (see Appendix D). Therefore, when each of the signal and idler paths is applied with a DCM, the QMWP three-tap filter becomes a parallel RF processor that can provide two-dimensional outputs with different FSR responses. Figure 6 demonstrates the two-dimensional three-tap QMWP filter by placing a DCM with the GDD of 330  ps/nm in the signal path and a DCM of 165 ps/nm in the idler path. It can be seen that the filtering FSR responses in the signal path [Fig. 6(a)] and idler path [Fig. 6(b)] are different. The result further verifies that dispersion, unlike the spectral selection and temporal modulation, cannot be directly mapped from one photon to its twin entangled photon.

    Two-dimensional parallel QMWP RF filtering demonstration. In the experimental setup, the DCM of −330 ps/nm is placed in the signal path, while the DCM of 165 ps/nm is placed in the idler path: (a) RF filtering result extracted from the signal photon waveform and (b) RF filtering result extracted from the idler photon waveform.

    Figure 6.Two-dimensional parallel QMWP RF filtering demonstration. In the experimental setup, the DCM of 330  ps/nm is placed in the signal path, while the DCM of 165 ps/nm is placed in the idler path: (a) RF filtering result extracted from the signal photon waveform and (b) RF filtering result extracted from the idler photon waveform.

    4. CONCLUSIONS

    In summary, we have demonstrated a QMWP signal processing system with energy–time entangled photon pairs being the optical carrier. Benefiting from the frequency anti-correlation and temporal correlation between photon pairs, RF modulation and spectral slicing on one photon can be nonlocally mapped onto its “twin” one. Based on such quantum-facilitated features, nonlocal RF phase shifting and a multi-tap frequency filter can be implemented. Such capability is crucial to realize encrypted microwave processing in modern communication and radar applications. More importantly, the QMWP RF filtering presents good immunity to the dispersion-induced frequency fading effect associated with the broadband carrier, which is still a big challenge in classical MWP. Furthermore, as both the signal and idler photon events can be utilized to extract the RF signal, a native two-dimensional parallel microwave signal processor can be provided. For example, the QMWP transversal filter has shown two parallel outputs with different FSR responses. These features well demonstrate the superiority of QMWP over classical MWP and open the door to numerous possible applications of MWP and related fields.

    Acknowledgment

    Acknowledgment. We thank Honglei Quan and Wenxiang Xue for their useful technical discussions. R. D., M. L., and S. Z. proposed this project. R. D. built the theory model. Y. J. designed and performed the experiment. Y. J., Y. Y., and H. H. carried out numerical simulations and analyzed the data. Y. Y., H. H., X. X., R. Q., T. L., N. Z., and M. L. contributed to the discussion of experimental results. Y. J., R. D., and S. Z. wrote the paper. R. D., M. L., and S. Z. supervised the research work. All authors commented on and revised the paper.

    APPENDIX A: POST-SELECTION METHOD

    According to Eq. (9), the square module of the two-photon temporal wave function can be reviewed as a function of the time difference of photon detection τ=t1t2, which can be deduced as |Ψ(τ)|2exp[(τDω˜F)21/σF2+D2σF2].

    It can be seen that the equation will have a peak when the time difference τ=Dω˜F. If the photon is sliced to a multi-wavelength channel, the equation will have several corresponding peaks. Therefore, according to the peaks of the function, the detected entangled photon at different wavelength channels can be identified. Considering that the coincidence correlation function G(2)(τ) is proportional to the equation, the photon’s wavelength channel can be identified by the coincidence correlation function. Precisely, based on the time tag of the detected photon, the correlation function can be calculated, and the function peak that the detected entangled photon belongs to can be identified. Through the calculation and identification process, the photon at different wavelength channels can be separately selected.

    Figure 7 plots the calculated coincidence distribution under different optical filter settings. Figure 7(a) corresponds to the coincidence result of an optical filter (OF) with a single passband on the signal path, whose central wavelength is set to 1560.20 nm with a bandwidth of 0.3 nm, and a DCM with 330 ps/nm in GDD on the idler path. The single peak corresponds to the single passband of the optical filter. Moreover, If the filter has three passbands, the coincidence result will have three corresponding peaks as Figs. 7(b) and 7(c) indicate. As can be seen in Fig. 7(c), the coincidence peaks count value decreases as the attenuation of the corresponding channels increases. Therefore, by selecting the photon in the corresponding peaks, the photon at different wavelength channels can be selected, and the carried RF modulation on the photon can be constructed. Moreover, the phase shifting and frequency filtering results in the paper can be tested.

    Coincidence histograms between the signal and idler photons for post-selection. (a) Coincidence result for the optical filter with a single passband; (b), (c) coincidence results for the optical filter with three passbands when the photon flux ratio of the passband is taken as (b) 1:1:1 and (c) 0.65 1 0.65.

    Figure 7.Coincidence histograms between the signal and idler photons for post-selection. (a) Coincidence result for the optical filter with a single passband; (b), (c) coincidence results for the optical filter with three passbands when the photon flux ratio of the passband is taken as (b) 1:1:1 and (c) 0.65 1 0.65.

    APPENDIX B: FREQUENCY FILTERING EFFECT OF THREE-TAP RF FILTER

    Since the TCSPC records only the temporal information of the detected photon, the temporal waveform of the modulated signal reconstruction requires further processing. Therefore, traditional spectral measuring equipment such as spectral analyzers and vector network analyzers cannot be used. By comparing the amplitude of the reconstructed temporal waveform with and without dispersion at different input signal frequencies, the frequency response of the QMWP RF filter can be calculated. This is the reason for using the amplitude ratio to demonstrate the RF filtering performance. Moreover, the amplitude of the reconstructed temporal waveform without dispersion can be calculated from the waveform of its non-dispersed twin photon because of the temporal correlation of photon pairs. For example, if the dispersion module is placed only in the idler path, the waveform of the non-dispersed signal photon will be the same as the waveform reconstructed from the idler photon without dispersion. If only one photon in the photon pair is dispersed, the frequency response is obtained by calculating the amplitude ratio between the waveform of the dispersed photon and the waveform of the non-dispersed twin photon. If both photons in the photon pair are dispersed, an extra path separated before DCMs is needed to calculate the amplitude of the reconstructed waveform without dispersion.

    In the QMWP RF filtering experiment, the frequency response is calculated from the reconstructed temporal waveform. By comparing the amplitude of the reconstructed temporal waveform from the dispersed photon and the waveform of the non-dispersed twin photon, the filtering performance can be evaluated. For example, Fig. 8 plots the temporal waveform of the entangled photon pairs at different frequencies when the DCM with a GDD of 330 ps/nm is placed in the idler path. When the modulation signal’s frequency is 3.5 GHz [Fig. 8(a)], the fitting amplitude of the signal’s waveform is close to the amplitude of the idler’s waveform. However, when the signal’s frequency is 4.76 GHz [Fig. 8(b)], the fitting amplitude of the signal is smaller than the amplitude of the idler and the amplitude ratio is 9.91 dB, which indicates the filtering effect. Furthermore, since dispersion is placed on the idler path, only the waveform of idler photons is filtered at a specific frequency. The insets depict the spectra of the waveform of the entangled photons, which also indicates the filtering effect when the frequency is 4.76 GHz. By further adjusting the frequency, the amplitude ratio result at different frequencies [as in Fig. 5(b)] can be plotted, which helps to get the frequency response of the QMWP filter.

    Reconstructed waveforms of the QMWP-based three-tap RF filter. (a) Waveform at filter’s passband (fRF=3.5 GHz, GDD=330 ps/nm); (b) waveform at filter’s stopband fRF=4.76 GHz, GDD=330 ps/nm.

    Figure 8.Reconstructed waveforms of the QMWP-based three-tap RF filter. (a) Waveform at filter’s passband (fRF=3.5  GHz, GDD=330  ps/nm); (b) waveform at filter’s stopband fRF=4.76  GHz, GDD=330  ps/nm.

    APPENDIX C: TUNABILITY OF THE THREE-TAP RF FILTER BASED ON THE QMWP METHOD

    The FSR tunability of the three-tap RF filter based on the QMWP method is further tested. The three passbands of the OF are maintained at center wavelengths of 1560.95 nm, 1561.75 nm, and 1562.55 nm, while their output photon flux ratio is adjusted to be about 0.65:1:0.65. With the GDD of the DCM in the idler path at values of 165 ps/nm, 330 ps/nm, and 495 ps/nm, the ratios of the amplitude as a function of the RF from 200 MHz to 8 GHz are correspondingly plotted in Figs. 9(a)–9(c) by orange rhombuses. From the plotted results, tunable FSRs from 7 GHz to 2.35 GHz are well demonstrated. The simulations based on the traditional MWP theory are given by solid blue curves, which show excellent agreement with the results as well.

    Tunability of the three-tap QMWP RF filter. Filtering responses with the GDD of the DCM in the idler path at values of (a) 165 ps/nm, (b) 330 ps/nm, and (c) 495 ps/nm, which result in FSRs of (a) 7 GHz, (b) 3.5 GHz, and (c) 2.35 GHz, respectively.

    Figure 9.Tunability of the three-tap QMWP RF filter. Filtering responses with the GDD of the DCM in the idler path at values of (a) 165 ps/nm, (b) 330 ps/nm, and (c) 495 ps/nm, which result in FSRs of (a) 7 GHz, (b) 3.5 GHz, and (c) 2.35 GHz, respectively.

    APPENDIX D: Manipulation of QMWP signal processing with DCM in the signal path

    For verification, a DCM of 330  ps/nm is put in the signal path, and RF phase shifting as well as three-tap filtering results also can be achieved from the post-selected signal photon counts. With the same settings as those for acquiring the results shown in Fig. 4(a), the filtering results on the signal path are plotted in Fig. 10. Similar filtering results are observed. By comparison, excellent consistency well demonstrates that an equivalent RF signal processing capability can be achieved from the post-selected signal or idler photon output.

    Experimental filtering response when the DCM with the GDD of 330 ps/nm is placed in the signal path.

    Figure 10.Experimental filtering response when the DCM with the GDD of 330 ps/nm is placed in the signal path.

    References

    [1] C. H. Lee. Microwave Photonics(2006).

    [2] J. Capmany, J. Mora, I. Gasulla, J. Sancho, J. Lloret, S. Sales. Microwave photonic signal processing. J. Lightwave Technol., 31, 571-586(2013).

    [3] D. B. Hunter, L. G. Edvell, M. A. Englund, 249-252(2006).

    [4] J. Yao. Photonics to the rescue: a fresh look at microwave photonic filters. IEEE Microw. Mag., 16, 46-60(2015).

    [5] X. Zou, L. Bing, P. Wei, L. Yan, J. Yao. Photonics for microwave measurements. Laser Photon. Rev., 10, 711-734(2016).

    [6] J. Capmany, B. Ortega, D. Pastor, S. Sales. Discrete-time optical processing of microwave signals. J. Lightwave Technol., 23, 702-723(2005).

    [7] J. Mora, M. Andrés, J. L. Cruz, B. Ortega, S. Sales. Tunable all-optical negative multitap microwave filters based on uniform fiber Bragg gratings. Opt. Lett., 28, 1308-1310(2003).

    [8] S. Pan, Y. Zhang. Microwave photonic radars. J. Lightwave Technol., 38, 5450-5484(2020).

    [9] F. Laghezza, F. Scotti, G. Serafino, L. Banchi, V. Malaspina, P. Ghelfi, A. Bogoni. Field evaluation of a photonics-based radar system in a maritime environment compared to a reference commercial sensor. IET Radar Sonar Navig., 9, 1040-1046(2015).

    [10] P. Rakshit, N. R. Das. Effect of device parameters on improving the quantum efficiency of a lateral Si p–i–n photodetector. Opt. Quantum Electron., 52, 371(2020).

    [11] J. Mora, J. L. Cruz, A. Diez, M. V. Andres, J. Capmany. Microwave photonics based on fiber Bragg gratings. International Conference on Transparent Optical Networks, 175-179(2003).

    [12] Y. Yang, Y. Jin, X. Xiang, T. Hao, W. Li, T. Liu, S. Zhang, N. Zhu, R. Dong, M. Li. Single-photon microwave photonics. Sci. Bull., 67, 700-706(2022).

    [13] H. Fedder, S. Oesterwind, M. Wick, I. Shavrin, M. Schlagmüller, F. Olbrich, P. Michler, T. Veigel, M. Berroth, N. Walter. Characterization of electro-optical devices with low jitter single photon detectors -- towards an optical sampling oscilloscope beyond 100 GHz. European Conference on Optical Communication (ECOC), 1-3(2018).

    [14] X. Wang, B. A. Korzh, P. O. Weigel, D. J. Nemchick, B. J. Drouin, W. Becker, Q.-Y. Zhao, D. Zhu, M. Colangelo, A. E. Dane. Oscilloscopic capture of greater-than-100 GHz, ultra-low power optical waveforms enabled by integrated electrooptic devices. J. Lightwave Technol., 38, 166-173(2019).

    [15] B. Korzh, Q.-Y. Zhao, J. P. Allmaras, S. Frasca, T. M. Autry, E. A. Bersin, A. D. Beyer, R. M. Briggs, B. Bumble, M. Colangelo. Demonstration of sub-3 ps temporal resolution with a superconducting nanowire single-photon detector. Nat. Photonics, 14, 250-255(2020).

    [16] R. Quan, R. Dong, Y. Zhai, F. Hou, X. Xiang, H. Zhou, C. Lv, Z. Wang, L. You, T. Liu. Simulation and realization of a second-order quantum-interference-based quantum clock synchronization at the femtosecond level. Opt. Lett., 44, 614-617(2019).

    [17] R. Quan, Y. Zhai, M. Wang, F. Hou, S. Wang, X. Xiang, T. Liu, S. Zhang, R. Dong. Demonstration of quantum synchronization based on second-order quantum coherence of entangled photons. Sci. Rep., 6, 30453(2016).

    [18] F. Hou, R. Quan, R. Dong, X. Xiang, B. Li, T. Liu, X. Yang, H. Li, L. You, Z. Wang. Fiber-optic two-way quantum time transfer with frequency-entangled pulses. Phys. Rev. A, 100, 023849(2019).

    [19] D. Feng. Review of quantum navigation. IOP Conf. Ser., 237, 032027(2019).

    [20] C. Y. Gao, P. L. Guo, B. C. Ren. Efficient quantum secure direct communication with complete Bell-state measurement. Quantum Eng., 3, e83(2021).

    [21] H. Zhang, Z. Sun, R. Qi, L. Yin, G.-L. Long, J. Lu. Realization of quantum secure direct communication over 100 km fiber with time-bin and phase quantum states. Light Sci. Appl., 11, 83(2022).

    [22] J. Mora, A. Ruiz-Alba, W. Amaya, A. Martinez, V. Garcia-Munoz, D. Calvo, J. Capmany. Microwave photonics parallel quantum key distribution. arXiv(2011).

    [23] T. B. Pittman, Y. Shih, D. Strekalov, A. V. Sergienko. Optical imaging by means of two-photon quantum entanglement. Phys. Rev. A, 52, R3429-R3432(1995).

    [24] M. Malik, O. S. Magaña-Loaiza, R. W. Boyd. Quantum-secured imaging. Appl. Phys. Lett., 101, 241103(2012).

    [25] L. Jaeger. The Second Quantum Revolution: From Entanglement to Quantum Computing and Other Super-Technologies(2018).

    [26] Y. Jin, Y. Yang, H. Hong, X. Xiang, R. Quan, T. Liu, S. Zhang, N. Zhu, M. Li, R. Dong. Quantum microwave photonics in radio-over-fiber systems. Photon. Res., 10, 1669-1678(2022).

    [27] V. Averchenko, D. Sych, G. Schunk, U. Vogl, C. Marquardt, G. Leuchs. Temporal shaping of single photons enabled by entanglement. Phys. Rev. A, 96, 043822(2017).

    [28] V. Averchenko, D. Sych, C. Marquardt, G. Leuchs. Efficient generation of temporally shaped photons using nonlocal spectral filtering. Phys. Rev. A, 101, 013808(2020).

    [29] V. Giovannetti, L. Maccone, J. H. Shapiro, F. N. Wong. Extended phase-matching conditions for improved entanglement generation. Phys. Rev. A, 66, 043813(2002).

    [30] X. Xiang, R. Dong, R. Quan, Y. Jin, Y. Yang, M. Li, T. Liu, S. Zhang. Hybrid frequency-time spectrograph for the spectral measurement of the two-photon state. Opt. Lett., 45, 2993-2996(2020).

    [31] J. Wu, L. You, S. Chen, H. Li, Y. He, C. Lv, Z. Wang, X. Xie. Improving the timing jitter of a superconducting nanowire single-photon detection system. Appl. Opt., 56, 2195-2200(2017).

    Yaqing Jin, Ye Yang, Huibo Hong, Xiao Xiang, Run'ai Quan, Tao Liu, Ninghua Zhu, Ming Li, Shougang Zhang, Ruifang Dong. Surpassing the classical limit of the microwave photonic frequency fading effect by quantum microwave photonics[J]. Photonics Research, 2023, 11(6): 1094
    Download Citation