
Jieshu Zou, Fei Wang. Simultaneous measurement of SO2 and NO2 concentration using an optical fiber-based LP-DOAS system[J]. Chinese Optics Letters, 2020, 18(2): 021201
- Chinese Optics Letters
- Vol. 18, Issue 2, 021201 (2020)
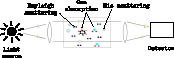
Fig. 1. Basic principle for measurement of trace gas concentrations in the open atmosphere.
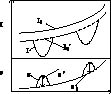
Fig. 2. Principle of DOAS: separate broadband and narrowband spectral structures.
Fig. 3. Schematic diagram of DOAS system: (a) traditional DOAS, (b) DOAS based on Y-type optical fiber. 1, xenon arc lamp; 2, UV-enhanced reflector; 3, lamp house; 4, lens coupler; 5, Y-type fiber; 5A, flat reflecting mirror; 5B, flat reflecting mirror; 5C, receiving fiber; 6, main mirror of telescope; 7, absorption cell; 8, retro-reflector; 9, spectrometer; 10, computer.
Fig. 4. Fiber structure: (a) Y-type fiber bundle, (b) end plane structure of fiber.
Fig. 5. Schematic diagram of calibration experiment. 1,
Fig. 6. Data analysis process.
Fig. 7. Absorption cross section of
Fig. 8. Convolution of absorption cross section: (a)
Fig. 9. Separation of absorption cross section: (a)
Fig. 10. Measured spectrum (top) and denoising results (bottom): (a)
Fig. 11. Differential optical density (top) and differential absorption cross section (bottom): (a)
Fig. 12. Calibration with standard gas: (a)
Fig. 13. Measurement of mixture gas: (a) calibration with standard
Fig. 14. Field measurement of DOAS: (a) main body of DOAS system, (b) retro-reflector array.
Fig. 15. Comparison of the measured concentration from DOAS and monitoring station: (a)

Set citation alerts for the article
Please enter your email address
© Copyright 2018-2021 | Chinese Laser Press. All Rights Reserved 沪ICP备15018463号-20