Jieshu Zou, Fei Wang, "Simultaneous measurement of SO2 and NO2 concentration using an optical fiber-based LP-DOAS system," Chin. Opt. Lett. 18, 021201 (2020)
Copy Citation Text
SO2 and NO2 are the most important pollution in atmosphere. An optimized long path (LP) differential optical absorption spectroscopy (DOAS) system of high light intensity at an ultraviolet (UV) wavelength is proposed and used to measure the concentration of SO2 and NO2 simultaneously. In contrast to the traditional DOAS, the system adopted a Y-type optical fiber structure instead of a combination of mirrors in the telescope. The UV light intensity test shows that the light intensity of UV can arrive to above 80% of the max measuring range when the light path reaches 135 m, and the integral time of the spectrograph is only 15 ms. The system is proved to be efficacious through laboratory calibration. The maximum error of SO2 calibration is 4.19%, and is 5.22% for NO2. The error of the SO2 and NO2 mixture calibration is within 10%. Field measurement is implemented in a wastewater treatment plant in winter. The measurement light path is 738 m. The concentration of SO2 varies from 6 μg/m3 (2.26 ppb) to 20 μg/m3 (7.52 ppb), and the concentration of NO2 varies from 100 μg/m3 (53.2 ppb) to 200 μg/m3 (106.4 ppb) approximately. The results are in accordance with the data from a monitoring station nearby in magnitude order and variation tendency mostly.
Sulfur dioxide () and nitrogen dioxide () can be produced by both nature sources and anthropogenic factors. is mainly from biomass burning or combustion of fossil fuels. It also comes from lightning and microbiological activity in soils. It plays an important part in the photochemically induced catalytic production of the ozone, which results in summer smog. Release of also causes nitric acid deposition and is harmful to human health. is mainly from volcanic activity and combustion of fossil fuels. It causes sulfuric acid deposition and is harmful to human health. As the rapid development of economy, for satisfying the energy demand, and from anthropogenic sources increased greatly and caused severe environmental problems over the globe. The measurement and monitoring of and concentrations are important to estimate the air quality and the variation tendency, to check the effect of pollution control strategies and technology, to research the transport of pollution, and to investigate the formation of aerogel and chemistry reaction in atmosphere.
The monitoring data of and are mainly from satellite nadir view and ground-based local monitoring stations. The satellite nadir measurements from the global ozone mapping experiment (GOME), scanning imaging absorption spectrometer for atmospheric chartography (SCIAMACHY), GOME-2, and ozone monitoring instrument (OMI) are tens of kilometers between different measurement points and return to the same place at least once a day, resulting in low resolution in space and time[1]. Thus, it cannot reveal the variation of emitted pollution peaks occurring in the morning and evening traffic. It also cannot reveal the pollution from a small area. Establishing air quality monitoring sites based on a ground network is important[2]. Usually, the point analyzer of used in the monitoring station is with the chemiluminescence method, while the measurement of is with the ultraviolet (UV) fluorescence method. These point analyzers are tedious in operation and data dealing and can only represent the value of the sampling point.
Most scientific research has focused on or concentration measurements separately, but few reference is given to measure and simultaneously. The measurement of and at the same time is important as the fight for oxygen in the combustion process. Differential optical absorption spectroscopy (DOAS) supplies a good method for simultaneous measurement of and [3,4]. Furthermore, DOAS measures signals of relative light intensity rather than absolute radiant power, which is sensitive to environment factors such as temperature[5]. Zhou et al. calibrated the DOAS method with flue gas of 2029 ppm (parts per million) and 505 ppm, where the average deviation is less than 1.5%, and the maximum deviation is less than 4.5%[6]. Lee et al. measured spatial and temporal variations of over Beijing in autumn and found a maximum of 65.8 ppb (parts per billion) during the measurement day[7]. Gobiet et al. monitored urban air pollution in a city in Austria using the DOAS method, where the concentration of at ground level is μ on average, and the is μ on average[3].
Sign up for Chinese Optics Letters TOC. Get the latest issue of Chinese Optics Letters delivered right to you!Sign up now
DOAS can be categorized as active DOAS and passive DOAS according to the light source kind. Active DOAS uses artificial light such as LED light or xenon arc light, while passive DOAS uses natural light such as sun light. Passive DOAS has developed many forms from zenith scattered light DOAS (ZSL-DOAS) to multi-axis DOAS (MAX-DOAS) and imaging DOAS (I-DOAS)[8–10]. Passive DOAS has the merits of simple construction and long light path extending to tens or hundreds of kilometers. However, the accuracy is low because of the influence of the Fraunhofer structure of sunlight, the ring effect, the uncertain light path that is sensitive to aerogel, and the uncertainties in the assumptions made for the radiative transfer calculations. Active DOAS does not have these problems because it uses artificial light, which is distinguished from sunlight and has a definite light path.
The research activity now is more focused on passive DOAS[11], but a few studies focus on the development of active DOAS. One of the important forms of active DOAS is long path DOAS (LP-DOAS). For long distance measurement, the efficacious light intensity of LP-DOAS is especially important for measurement precision. Efficiency of each optic element and combination model will affect light intensity output of DOAS. The integrated measurement system structure of DOAS was first designed by OPSIS company of Sweden and was successfully applied to the analysis of Hg[12]. Plane et al. used retro-reflector placed at the opposite of a Cassegrain telescope, which can return the light emitted by telescope in the same way, and used the photoelectric diode array (PDA) as the light intensity detector instead of the photomultiplier (PMT)[13]. An optical fiber structure instead of combination of mirrors in the Cassegrain telescope was adapted in our study. Optical fiber integration is a powerful technology to control light paths[14]. This optical fiber form is convenient for arranging the measurement equipment. Once the optical fiber is connected, the light can transmit through the fiber from the light source to the telescope and from the telescope to the spectrometer, no matter where the light source and spectrometer are.
The theory of DOAS is based on Lambert–Beer’s law and is expressed as where represents the measured intensity, is the unattenuated intensity, L is the light path, is the concentration of gas, and is the absorption cross section. Usually, the unit of L is centimeters (cm), while is in , and is in . The unit of , can transform to parts per million (ppm) or micrograms per meter cubed (μ) by multiplying a constant.
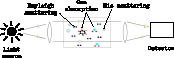
In real atmosphere, more than one kind of absorption gas and other scattering particles exist, which also reduces the light intensity, as shown in Fig. 1. By expanding Lambert–Beer’s law, all contributions to the light attenuation can be expressed by where represents different kinds of gases, represents the Rayleigh scattering coefficient, and represents the Mie scattering coefficient.
Figure 1.Basic principle for measurement of trace gas concentrations in the open atmosphere.
Rayleigh scattering, Mie scattering, and many trace gas absorptions show broad spectral characteristics. Certain trace gases, such as and , however, show narrowband absorption structures. The principle of DOAS is separate from the broad and narrowband spectral structures, as illustrated in Fig. 2. Separating the absorption cross section into two parts can be expressed as where is the broadband part, and is the narrowband part of the absorption cross section. is also called the differential absorption cross section. Denote the broad part of intensity as :
Figure 2.Principle of DOAS: separate broadband and narrowband spectral structures.
The gas concentration is obtained by fitting the measured value and differential absorption cross section through the least squares method and is expressed as where is called the differential optical density.
The traditional DOAS controls the light transmitting path by a group of mirrors, which is illustrated in Fig. 3(a). The specific light transmits as follows: the light emitted by a xenon arc lamp is reflected by flat reflecting mirror 5A and arrives at the main paraboloid reflecting mirror (called the main mirror for short). The light collimated by the main mirror emits to the atmosphere (sample to be measured) and arrives at the retroreflector array. The light reflected to the retroreflector array returns to the main mirror through the same path. The parallel light collected by the main mirror arrives at the flat reflecting mirror 5B and finally arrives at the spectrometer through receiving fiber 5C for data analysis.
Figure 3.Schematic diagram of DOAS system: (a) traditional DOAS, (b) DOAS based on Y-type optical fiber. 1, xenon arc lamp; 2, UV-enhanced reflector; 3, lamp house; 4, lens coupler; 5, Y-type fiber; 5A, flat reflecting mirror; 5B, flat reflecting mirror; 5C, receiving fiber; 6, main mirror of telescope; 7, absorption cell; 8, retro-reflector; 9, spectrometer; 10, computer.
Compared with the traditional DOAS, the proposed DOAS adopted the Y-type optical fiber structure instead of a combination of mirrors in a telescope, which is illustrated in Fig. 3(b). The shared end of the optical fiber is fixed at the best emission point of the telescope. The light emitted and received by telescope is via this shared end. One end of the opposite shared end of the optical fiber connects the xenon arc lamp, and the other end connects to the spectrograph. The specific light transmits as follows: the light emitted by the xenon arc lamp is focused by a lens, enters into the Y-type fiber 5, and emits to the main mirror. The light collimated by the main mirror emits to the atmosphere (sample to be measured) and arrives at the retroreflector array. The light reflected to the retroreflector array returns to the main mirror through the same path. The parallel light collected by the main mirror arrives at Y-type fiber 5 and finally arrives at the spectrometer for data analysis.
The main structure of the telescope is a parabolic mirror, of which the diameter is 201 mm and the focus length is 724 mm. The position of the light emitting point, where the optical fiber is fixed at 727.57 mm, has a 3.57 mm deviation from the focus. The spread of imaging is smaller than that of emission at the focus. The light returned by the retro-reflector is received by the telescope. The strongest received intensity can be obtained at this emission point. The xenon arc lamp produced by Newport corporation is chosen for DOAS as the light source, which has high power of 150 W and varies smoothly in the UV wavelength ranging from 250 to 380 nm, where the trace gas to be measured has significant differential absorption structures. The xenon arc lamp is placed at the lamp house. There is a spherical reflector coated with UV-enhanced aluminized film at the back of the xenon arc lamp. The xenon arc lamp is placed at the focus of the reflector. The added reflector improves the output intensity by above 60%. Maya2000-Pro, which is a mini integration portable spectrograph produced by Ocean Optic corporation, is employed in this system. The spectral range of the spectrograph is 250–386 nm, corresponding to the gas absorption structure and light source. The resolution of the spectrograph is 0.55 nm, and the slit width is 100 μm, respectively. The Y-type fiber, which is shown in Fig. 4(a), is produced by Ocean Optic corporation. The diameter of the fiber is μ, and the length is 2 m. The fiber bundle contains six incidence fibers and one receiving fiber. One end of the incidence fibers connects the light source, and one end of the receiving fiber connects the spectrometer. The shared end probe is fixed at the best emitting point of the telescope. Six incidence fibers surround one receiving fiber, which is shown in Fig. 4(b). This structure can insure the parallel arrangement of fibers. A UV light intensity test of the system is carried out at Zhejiang University. The UV light intensity test results show that the light intensity of the UV can arrive to above 80% of the max measuring range when the light path reaches 135 m, and the integral time of the spectrograph is only 15 ms.
Figure 4.Fiber structure: (a) Y-type fiber bundle, (b) end plane structure of fiber.
The calibration of system is implemented by measuring standard and gas at the laboratory. The schematic diagram of the experiment is shown in Fig. 5. The concentration of standard and is adjusted by the balance gas and expressed as where and denote the initial concentration, 200 ppm and 500 ppm, respectively. and represent concentrations in the absorption cell. , , and represent the mass flow rate of corresponding gas.
The data analysis flow is illustrated in Fig. 6. The absorption cross section of and comes from the Max Planck Institution, which is shown in Fig. 7. The analysis window of is selected at 290–310 nm, and it is 340–360 nm for . The choice of fitting windows is important for analysis. The objective gas should have strong differential absorption intensity and little interference by other gas in the fitting windows. Rivera et al. chose 420–460 nm for evaluation and considered the absorption cross section of and in the fitting process[15]. In the case when the concentration of is much higher than that of other interference gases, ignoring the cross sensitivity is reasonable. Friedeburg et al. measured the from motorway emissions. The analysis wavelength is 420–450 nm, and no other interference gas is considered[16]. Lee et al. chose the wavelength range of 396–416 nm for , which avoided the interference of other gases[17]. We chose the wavelength range of 340–360 nm for analysis. Although the differential absorption in this range is a little smaller than that in the range 420–460 nm, it can avoid other gas interference efficaciously. BrO and OClO have strong differential absorption in the range 290–310 nm. Nevertheless, the concentration of BrO and OClO in the atmosphere is much lower than that of , so it can be ignored in the analysis process. Even at the volcanic emission where the concentration of BrO and OClO is much high than in atmosphere, the ratio of BrO and and the ratio of OClO and are about , and the retrieval of can ignore the influence of BrO and OClO[10]. The absorption cross section obtained from the database should convolve with instrument function to obtain the absorption cross section at experiment conditions. The convolution results are shown in Fig. 8. The key step is the separation of broad and narrowbands of the spectrum. The most common method is polynomial fit. The polynomial fit method is simple, but it cannot fit the broadband sufficiently. For more detailed fitting of the broadband structure, moving the average method is used for separating the spectrum. The separation of the absorption cross section is shown in Fig. 9. The measured spectrum and denoising results are shown in Fig. 10. The measured spectrum is represented for 200 ppm and 500 ppm . The light path is 60 cm. Most noising of low frequency, such as stray light produced by sunlight or mirror reflection, is removed in the separating process. The noising of high frequency raised by instruments, such as electrical noise and dark current, is removed by the wavelet denoising method. In the denoising process, we chose ‘db6’ as the wavelet function and implemented three layers of decomposition. The method used to separate the measured absorption spectrum should be the same as for the absorption cross section in the data dealing process. Lastly, the least squares fit is implemented for the differential optical density and differential absorption cross sections to obtain gas concentration. The differential optical density and differential absorption cross section are shown in Fig. 11.
Results for a single kind of gas measurement by DOAS are shown in Fig. 12. The measurement range of is from 40 to 200 ppm. The maximum error of is 4.19%. The measurement range of is from 100 to 500 ppm. The maximum error of calibration is 5.22%. Results for simultaneous measurement of the and mixture are shown in Fig. 13. The concentration of is from 40 to 100 ppm, and the concentration of is from 100 to 250 ppm. The errors are within 10% mostly.
Figure 12.Calibration with standard gas: (a) , (b) .
The field measurement of air online monitoring was carried out in winter at a wastewater treatment plant, which is shown in Fig. 14. The main instruments of the system were placed at the second floor of a central control building and were 5 m from the ground. The retro-reflector array was placed at the top of the pumping water tower, which is 12 m from the ground. The distance between telescope and retro-reflector is 369 m, measured by a laser range finder, so the light path is 738 m. The measured results compared with data from a monitoring station nearby are shown in Fig. 15. The integrating time of the spectrograph is within 500 ms in the measurement process, which shows high time resolution and satisfies the time requirement of continuous monitoring technology.
Figure 14.Field measurement of DOAS: (a) main body of DOAS system, (b) retro-reflector array.
The measurement result is in accordance with the data from the monitoring station in terms of order of magnitude and variation tendency mostly, as shown in Fig. 15. The difference between DOAS and monitoring station may be caused by the distance between the measuring locations, which is 3.3 km. Specially, the concentration of measured by DOAS and the local monitoring station has different trends at the time of 16:00. That may be caused by effects of local meteorology. Monitoring stations can easily be influenced by small sources in their direct vicinity and small-scale wind systems. When there is a wind blowing from the source to the monitoring station at that time, it may cause the rise of concentration at the monitoring station, while the measured concentrations by DOAS are averaged over the light path and barely influenced by small-scale variances.
The concentration of varies from μ (2.26 ppb) to μ (7.52 ppb), and the concentration of varies from μ (53.2 ppb) to μ (106.4 ppb) approximately. The concentration of at night is μ, which is higher than that at daytime of μ. The phenomenon appears maybe because the temperature is lower at night and the air cannot spread easily.
An optical fiber-based LP-DOAS system to measure and simultaneously is introduced in this paper. The system is calibrated with a laboratory experiment, and then implemented with a field measurement. The maximum error of calibration is 4.19%, and is 5.22% for . The error of measuring and simultaneously is within 10%. The online measurement of and is in good accordance with the monitoring station result in terms of order of magnitude and variation tendency. It is efficacious for the optical fiber-based LP-DOAS to monitor air pollution online.
References
[1] A. Hillboll, A. Richter, J. P. Burrows. Atmos. Chem. Phys., 13, 4145(2013).
Jieshu Zou, Fei Wang, "Simultaneous measurement of SO2 and NO2 concentration using an optical fiber-based LP-DOAS system," Chin. Opt. Lett. 18, 021201 (2020)