• Photonics Research
  • Vol. 4, Issue 5, 0202 (2016)
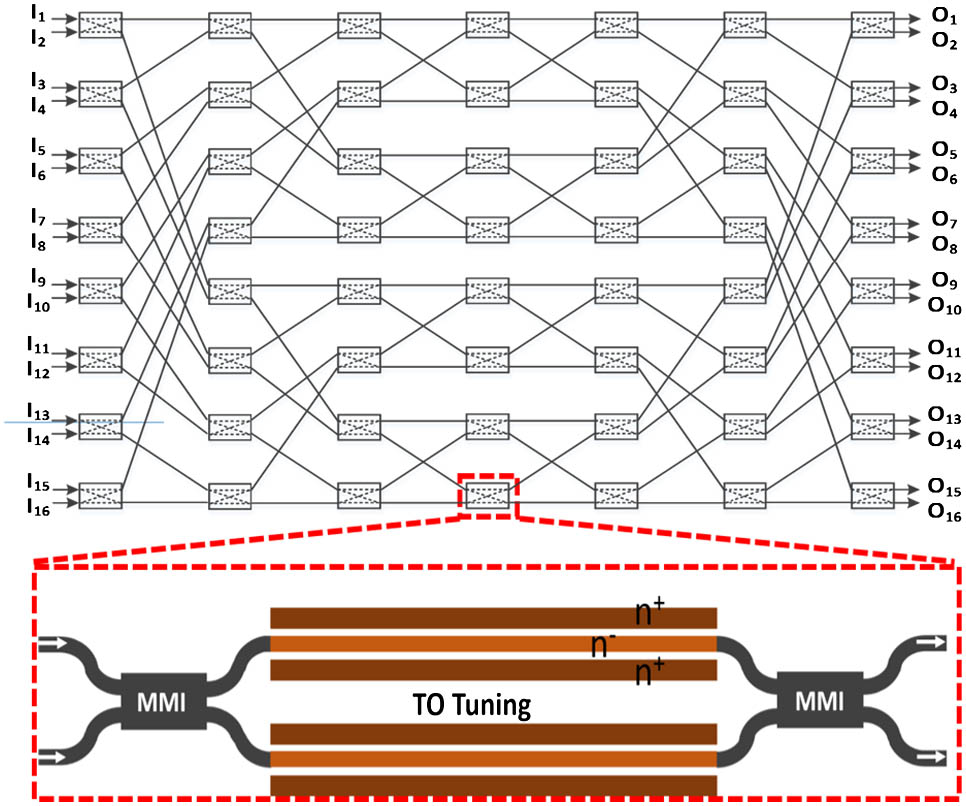
Shuoyi Zhao, Liangjun Lu, Linjie Zhou*, Dong Li, Zhanzhi Guo, and Jianping Chen
Author Affiliations
  • State Key Laboratory of Advanced Optical Communication Systems and Networks, Department of Electronic Engineering, Shanghai Jiao Tong University, Shanghai 200240, China
  • show less
    DOI: 10.1364/prj.4.000202 Cite this Article Set citation alerts
    Shuoyi Zhao, Liangjun Lu, Linjie Zhou, Dong Li, Zhanzhi Guo, Jianping Chen. 16 × 16 silicon Mach–Zehnder interferometer switch actuated with waveguide microheaters[J]. Photonics Research, 2016, 4(5): 0202 Copy Citation Text show less
    Schematic of the 16×16 optical switch. Inset shows the structure of the MZI switch element.
    Fig. 1. Schematic of the 16×16 optical switch. Inset shows the structure of the MZI switch element.
    (a) Optical microscope image of the switch chip. The inset shows the zoomed-in view of the MZI switch elements. (b) Photo of the 16×16 switch in a sealed metal box. (c) Photo of the 16×16 switch after electrical and optical package. The inset shows the zoomed-in view of a fiber array attached to the switch chip using UV-curable adhesive.
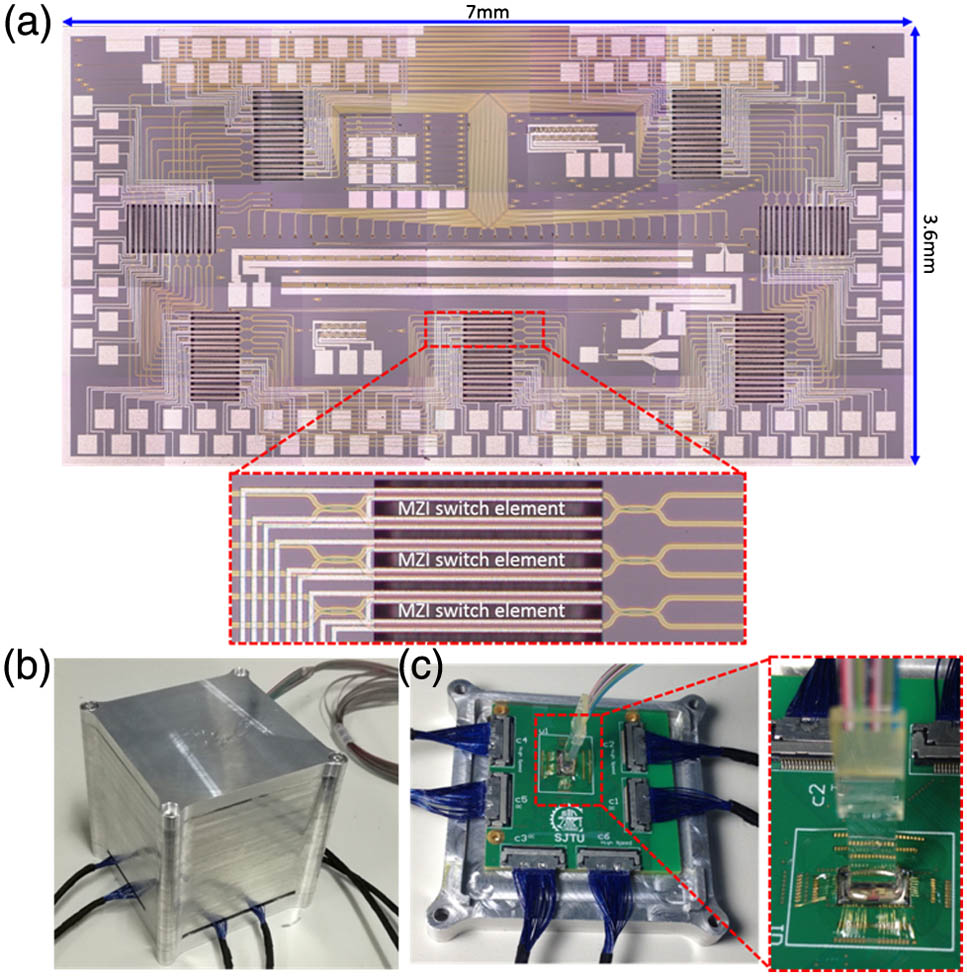
    Fig. 2. (a) Optical microscope image of the switch chip. The inset shows the zoomed-in view of the MZI switch elements. (b) Photo of the 16×16 switch in a sealed metal box. (c) Photo of the 16×16 switch after electrical and optical package. The inset shows the zoomed-in view of a fiber array attached to the switch chip using UV-curable adhesive.
    Transmission spectra at different TO power consumptions for the cross port and the bar port of an MZI switch element.
    Fig. 3. Transmission spectra at different TO power consumptions for the cross port and the bar port of an MZI switch element.
    Transmission spectra of all optical paths at the all-cross and the all-bar states of the 16×16 switch.
    Fig. 4. Transmission spectra of all optical paths at the all-cross and the all-bar states of the 16×16 switch.
    Measured transmission spectra of the 16×16 switch at the all-cross state.
    Fig. 5. Measured transmission spectra of the 16×16 switch at the all-cross state.
    Measured transmission spectra of the 16×16 switch at the all-bar state.
    Fig. 6. Measured transmission spectra of the 16×16 switch at the all-bar state.
    Time-domain optical response of the switch element. (a) Applied square-wave electrical drive signal. (b) Measured optical waveform. The dashed lines indicate the 10% and 90% power levels.
    Fig. 7. Time-domain optical response of the switch element. (a) Applied square-wave electrical drive signal. (b) Measured optical waveform. The dashed lines indicate the 10% and 90% power levels.
    Measured constellation diagrams of a 40 Gb/s QPSK signal. (a) BtB transmission, (b) the all cross state, and (c) the all bar state.
    Fig. 8. Measured constellation diagrams of a 40  Gb/s QPSK signal. (a) BtB transmission, (b) the all cross state, and (c) the all bar state.
     S1(mW)S2(mW)S3(mW)S4(mW)S5(mW)S6(mW)S7(mW)
     all “0”all “1”all “0”all “1”all “0”all “1”all “0”all “1”all “0”all “1”all “0”all “1”all “0”all “1”
    13.8628.024.548.740.710.79.8326.33.6319.65.1024.63.2723.6
    24.2025.63.1824.210.027.10.8520.11.3018.61.662124.745.5
    33.2625.31.7820.41.9020.47.9527.613.934.214.333.75.7323.7
    47.9728.55.7026.66.2624.12.4219.90.4418.83.4924.73.6422.6
    512.236.04.9424.09.0629.47.4228.43.3422.710.229.340.311.4
    64.4924.62.0519.84.8826.09.7330.96.4426.913.832.51.8520.4
    720.542.332.46.401.4221.23.5522.73.3521.29.5628.31.2218.1
    81.5821.717.435.927.03.648.6928.619.639.76.2624.715.434.6
    Table 1. Power Consumption at the All-Cross and the All-Bar Statesa
    TechnologiesPort CountTopologyInsertion Loss (dB)Cross Talk (dB)Power Consump. (mW)Reconfig. Time (μs)Footprint (mm2)
    [20] (MZI, TiN+pin)8×8BlockingNA−15 to −5 (20 nm)4.4–32.20.012NA
    [14] (MZI, TiN)8×8Switch and Select4±0.8−45 (30 nm)702508×8
    [11] (MZI, TiN)8×8PILOSS6.5±1−23.1NANA3.5×2.4
    [19] (MZI, TiN+p-i-n)16×16Benes6.713.9±1−20 to −10 (30 nm)881+2890.00610.7×4.4
    [10] (MZI, TiN)32×32PILOSS15.8±1−20 (1.8 nm)29303011×25
    [4] (MEMS-actuation)50×50Cross-bar<27.5<20 (13 nm)NA3.89×9
    [3] (MEMS-actuation)64×64Cross-bar<3.7−20NA0.98.6×8.6
    This work (MZI, WG heater)16×16Benes5.2±1∼−30 (10 nm)515+91321.787×3.6
    Table 2. Performance Comparison of Reported High-Port-Count Silicon Switch Fabrics
    Shuoyi Zhao, Liangjun Lu, Linjie Zhou, Dong Li, Zhanzhi Guo, Jianping Chen. 16 × 16 silicon Mach–Zehnder interferometer switch actuated with waveguide microheaters[J]. Photonics Research, 2016, 4(5): 0202
    Download Citation