• Journal of Infrared and Millimeter Waves
  • Vol. 40, Issue 1, 19 (2021)
Fei ZHANG1、2、3, Gao-Shan HUANG2、*, Xiao-Fei NIE4, Hong-Lou ZHEN4, Yong-Feng MEI2, and Run-Hua FAN1、3、**
Author Affiliations
  • 1College of Ocean Science and Engineering,Shanghai Maritime University,Shanghai 201306,China
  • 2Department of Materials Science,State Key Laboratory of ASIC and Systems,Fudan University,Shanghai 200433,,China
  • 3Shanghai Engineering Technology Research Centre of Deep Offshore Material,Shanghai Maritime University,Shanghai 201306,China
  • 4State Key Laboratory of Infrared Physics,Shanghai Institute of Technical Physics,Chinese Academy of Sciences,Shanghai 200083,China
  • show less
    DOI: 10.11972/j.issn.1001-9014.2021.01.004 Cite this Article
    Fei ZHANG, Gao-Shan HUANG, Xiao-Fei NIE, Hong-Lou ZHEN, Yong-Feng MEI, Run-Hua FAN. Stress evolution and its effects on the detection performance of self-rolled quantum well infrared detector[J]. Journal of Infrared and Millimeter Waves, 2021, 40(1): 19 Copy Citation Text show less
    Schematic diagrams of multi-layer films (left) and rolled-up quantum well infrared device (right). The blue curve is the neutral line which is the boundary between tensile stress (green arrows) and compressive stress (red arrows) in the right diagram. The SEM image (top view) of rolled-up quantum well nanomembrane is in the top right inset
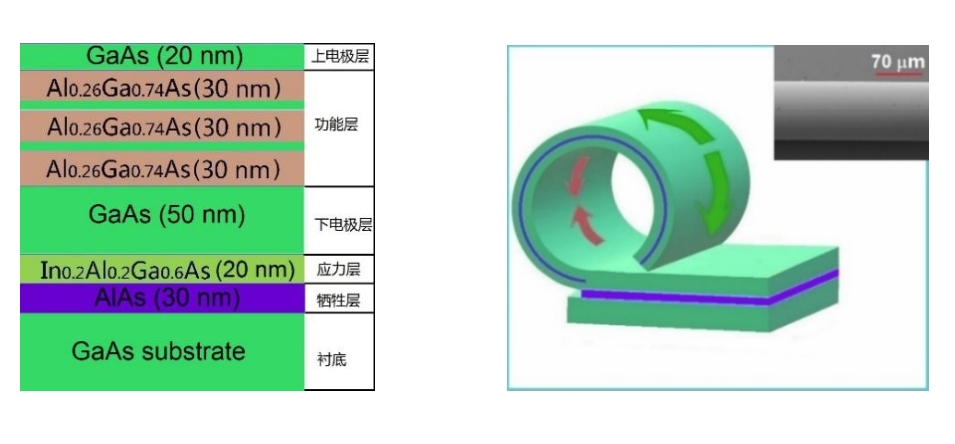
    Fig. 1. Schematic diagrams of multi-layer films (left) and rolled-up quantum well infrared device (right). The blue curve is the neutral line which is the boundary between tensile stress (green arrows) and compressive stress (red arrows) in the right diagram. The SEM image (top view) of rolled-up quantum well nanomembrane is in the top right inset
    (a) PL spectra of rolled-up nanomembranes with different diameters, (b)~(f) are the fitting curves of PL spectra. “Cumulative Curve” is abbreviated as “C. Curve”
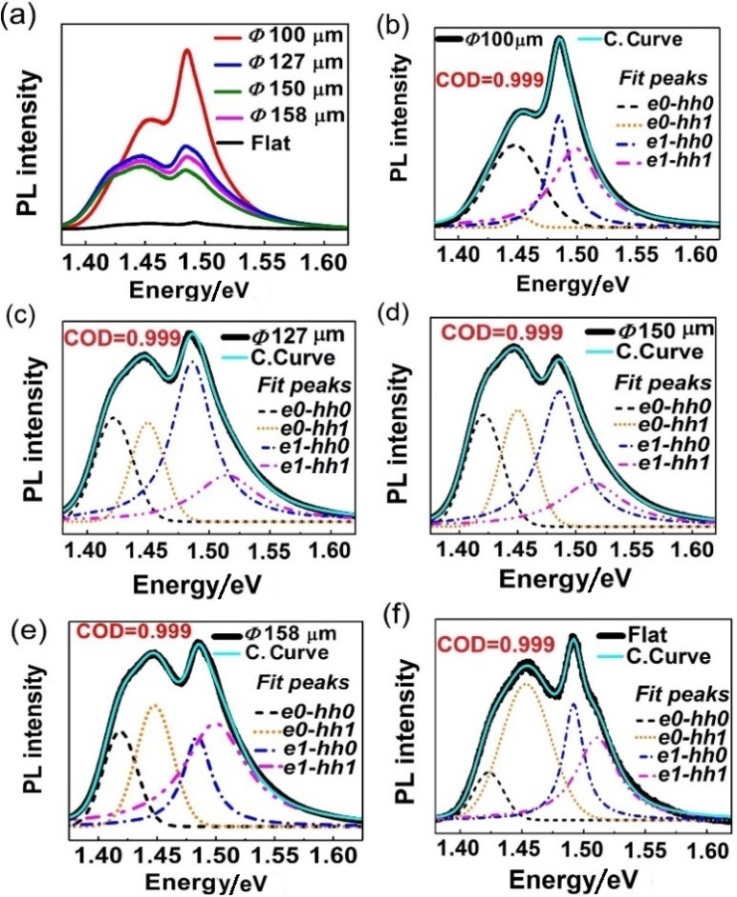
    Fig. 2. (a) PL spectra of rolled-up nanomembranes with different diameters, (b)~(f) are the fitting curves of PL spectra. “Cumulative Curve” is abbreviated as “C. Curve”
    (a) Interband transition peak changes with the diameter of rolled-up nanomembrane; (b) Intraband transition peaks (conduction band ∆e, Valence band ∆hh) change with the diameter of rolled-up nanomembrane; (c) The movement of conduction band under tensile stress. After rolling, both of energy levels (e0 and e1) move up and e0 moves more; (d) The red dotted line is the neutral line. Part I: The neutral line is at the outermost at the beginning of rolling. Part II: The neutral line moves to the outside of QW1. Part III: The neutral line moves between QW1 and QW2. Black arrows indicate the stress in QW1 and red arrows indicate the stress in QW2. The blue arrows indicate the resultant stresses in the two quantum wells. “Comululative Stress” is abbreviated as “C. Stress”
    Fig. 3. (a) Interband transition peak changes with the diameter of rolled-up nanomembrane; (b) Intraband transition peaks (conduction band ∆e, Valence band ∆hh) change with the diameter of rolled-up nanomembrane; (c) The movement of conduction band under tensile stress. After rolling, both of energy levels (e0 and e1) move up and e0 moves more; (d) The red dotted line is the neutral line. Part I: The neutral line is at the outermost at the beginning of rolling. Part II: The neutral line moves to the outside of QW1. Part III: The neutral line moves between QW1 and QW2. Black arrows indicate the stress in QW1 and red arrows indicate the stress in QW2. The blue arrows indicate the resultant stresses in the two quantum wells. “Comululative Stress” is abbreviated as “C. Stress”
    Photocurrent spectra of infrared detectors for flat and rolled-up (diameter: 62 μm) nanomembranes under 400 mV applied voltage, collected at 40 and 70 K separately
    Fig. 4. Photocurrent spectra of infrared detectors for flat and rolled-up (diameter: 62 μm) nanomembranes under 400 mV applied voltage, collected at 40 and 70 K separately
    (a) Optical microscopy image of wrinkled nanomembrane (top view). The peaks of raised parts are marked with “I”, “II”, “III” and“IV”. Figure (b) is the section view of the red dotted line in the top right corner of Figure (a). A, C points are the peaks and B point is the valley. “1”, “2” points are between A and B points. The values (unit: eV) in the brackets are the peaks of their PL spectra, where the peak positions are the same for “1” and “2” points, (c) Comparison of blackbody responsivity between rolled-up nanomembrane detector (diameter: 150 μm) and the wrinkled nanomembrane detector, (d) The red line is neutral line and the quantum wells in the dotted neutral line regions are both compressive. For the quantum wells in middle solid neutral line region, one quantum well is compressive, and the other is in tensile stress
    Fig. 5. (a) Optical microscopy image of wrinkled nanomembrane (top view). The peaks of raised parts are marked with “I”, “II”, “III” and“IV”. Figure (b) is the section view of the red dotted line in the top right corner of Figure (a). A, C points are the peaks and B point is the valley. “1”, “2” points are between A and B points. The values (unit: eV) in the brackets are the peaks of their PL spectra, where the peak positions are the same for “1” and “2” points, (c) Comparison of blackbody responsivity between rolled-up nanomembrane detector (diameter: 150 μm) and the wrinkled nanomembrane detector, (d) The red line is neutral line and the quantum wells in the dotted neutral line regions are both compressive. For the quantum wells in middle solid neutral line region, one quantum well is compressive, and the other is in tensile stress
    Fei ZHANG, Gao-Shan HUANG, Xiao-Fei NIE, Hong-Lou ZHEN, Yong-Feng MEI, Run-Hua FAN. Stress evolution and its effects on the detection performance of self-rolled quantum well infrared detector[J]. Journal of Infrared and Millimeter Waves, 2021, 40(1): 19
    Download Citation