Abstract
We demonstrate a high-energy all-fiber short wavelength gain-switched thulium-doped fiber laser for volumetric photoacoustic (PA) imaging of lipids. The laser cavity is constructed by embedding a short piece of gain fiber between a pair of fiber Bragg gratings (FBGs). Through using three pairs of FBGs with operation wavelengths at 1700, 1725, and 1750 nm, three similar lasers are realized with a cavity length of around 25 cm. Under a maximum pump energy of 300 μJ at 1560 nm, laser pulse energies of 58.2, 66.8, and 75.3 μJ are, respectively, achieved with a minimum pulse width of at a repetition rate of 10 kHz. Volumetric imaging of lipids is validated through scanning a fat beef slice with a PA microscopy system incorporated with the newly developed source, and a lateral resolution of 18.8 μm and an axial resolution of 172.9 μm are achieved. Moreover, the higher shooting speed of the developed source can potentially allow for increasing at twice the frame rate of current intravascular PA imaging.1. INTRODUCTION
The 1.7 μm region of the electromagnetic spectrum has been attracting increasing interests mostly because there are abundant molecular absorption lines [1], and it locates in the third near-infrared (NIR3) optical window (1600–1870 nm) for bioimaging [2–4]. At present, the need to develop laser sources in this region is mainly driven by applications such as diagnosis and treatment of various diseases [5,6], material processing [7], and deep bioimaging that leverages reduced optical scattering loss, locally decreased water absorption, and diminished phototoxicity of the 1.7 μm light compared with that at shorter wavelengths [8–10]. A representative example is lipids detection with spectroscopic photoacoustic (PA) imaging, which exploits the wavelength-dependent absorption of the first overtone transition of the C-H bond at around 1720 nm and acoustic detection of the resultant thermally induced ultrasound [11]. Thanks to the label-free high-contrast detection and high lateral resolution imaging determined by the exciting beam size, this imaging modality has been successively demonstrated in the diagnosis of intravascular atherosclerosis [12,13], mapping the white matter loss and regeneration in myelin sheath [14], and the brain structure [15]. However, because practical applications such as intravascular PA imaging generally require high-energy laser pulses (up to several tens of micro-joules) to generate sufficient ultrasonic signals, previous demonstrations mainly employed expensive and cumbersome optical parametric oscillators (OPOs) to provide the exciting source with the highest pulse repetition rate of 5 kHz [16–19].
Due to the 1.7 μm band hardly being covered by the operating wavelength range of general rare-earth-ions-doped fiber lasers, there were few attempts to develop fiber laser sources for practical PA imaging of lipids, although it has the advantages of high efficiency, compactness, and low cost. The primary experiments were demonstrated in Refs. [20,21], in which the 1.7 μm laser was filtered out from a supercontinuum source generated in an optical fiber that was pumped by high-power lasers at the well-developed 1.0 and 1.5 μm bands. However, the relatively low-power spectral density of supercontinuum creates a trade-off between the narrow bandwidth (more accurate absorption peak differentiation) and high pulse energy of the exciting laser source. After that, we demonstrated a gain-switched thulium-doped fiber laser (TDFL) with pulse energy and continuous wavelength tuning from 1690 to 1765 nm, and we successively applied it to PA imaging of adipose tissue [22]. Nevertheless, the previous work only realized two-dimensional (2D) PA microscopy (PAM) with nice lateral resolution, whereas the depth resolution, i.e., time-resolved ultrasonic detection, was compromised by the wide pulse width (minimum 150 ns). To realize volumetric imaging with decent resolution, the pulse duration should be around 10 ns or even shorter [23]. In addition, for volumetric PA tomography that is commonly used in intravascular imaging based on a catheter integrated with optical excitation and acoustic detection, a pulse energy of several tens of micro-joules is required [16–19].
In this paper, we propose a high-energy all-fiber gain-switched TDFL at 1.7 μm by using highly efficient pumping of a short piece of double-cladding thulium-doped fiber (TDF) and spectral filtering between a pair of fiber Bragg gratings (FBGs), of which the center wavelength can be accordingly customized. Compared with our previous demonstrations, the current laser system has a much shorter cavity length and smaller cavity round-trip loss endowed with the all-fiber configuration. Under a maximum pump energy of 300 μJ at 1560 nm, output pulse energies of 58.2, 66.8, and 75.3 μJ are, respectively, obtained at 1700, 1725, and 1750 nm with a repetition rate of 10 kHz. With the total length of the constructed laser cavity being around 25 cm, the achieved minimum pulse width is less than 16.7 ns. Volumetric imaging of lipids is realized with a lateral resolution of 18.8 μm and an axial resolution of 172.9 μm by implementing a PAM system with the developed source.
Sign up for Photonics Research TOC. Get the latest issue of Photonics Research delivered right to you!Sign up now
2. EXPERIMENTAL SETUP
Figure 1 shows the experimental setup of the all-fiber gain-switched TDFL and the associated PAM system. The laser cavity was a distributed Bragg reflector (DBR) structure constructed by a segment of high-gain double-cladding TDF (CorActive, DCF-TM-10/128) sandwiched by a narrowband FBG (NB-FBG) and a wideband FBG (WB-FBG). The insertion loss of splicing the gain fiber with the pigtails (Corning, SMF28e) of the FBGs was measured to be 0.7 dB. The center reflectivity/3 dB bandwidth of the NB-FBG and WB-FBG is, respectively, 30%/0.7 nm and . In the current experiment, three similar laser cavities were constructed with different center wavelengths (1700, 1725, and 1750 nm) of the FBG pairs, whereas the corresponding TDF length (i.e., 16, 17, and 18 cm) was optimized by using the cutting-back method with respect to the lasing efficiency. The pump source came from a 1560 nm laser diode (LD), which was intensity-modulated by a Mach–Zehnder modulator (MZM). A polarization controller (PC) was employed to adjust the state of polarization (SOP) of the LD output to realize maximum extinction ratio of the resulting pump pulse. The transmitted light was then successively amplified by two erbium-doped fiber amplifiers (EDFA1 and EDFA2), with a 1 nm tunable bandpass filter (TBPF) inserted after EDFA1 to filter out the unwanted amplified spontaneous emission (ASE). The amplified pump was then used to forward pump the laser cavity through the WB-FBG, with the signal laser output from the NB-FBG. Finally, a 1560/1700 nm fusion-type wavelength-division-multiplexing (WDM) coupler was used to separate the 1.7 μm laser and the residual pump. The laser output was then collimated and sent to the PAM system, of which the details can be found in Ref. [22]. In the current work, a microscope objective (OBJ, M-, Newport) with a numerical aperture of 0.4 was employed to launch the laser light onto the sample to increase the imaging depth. In addition, the PA signal detected by the ultrasound transducer (UT) was amplified by an RF amplifier with 28 dB gain before the low-pass filter (LPF).
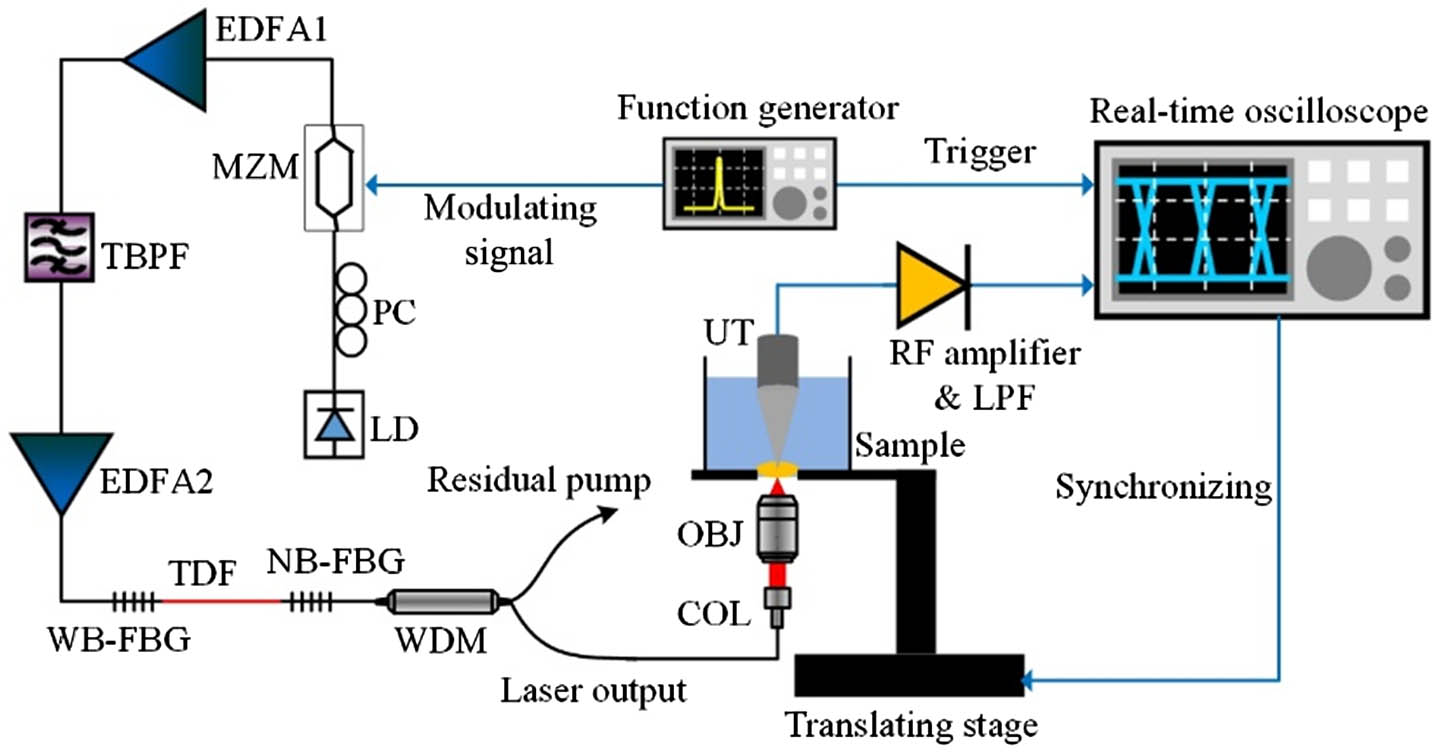
Figure 1.Experimental setup of the all-fiber gain-switched TDFL and the associated PAM system. COL, collimator.
3. EXPERIMENTAL RESULTS AND DISCUSSION
Gain-switched laser operation was examined for the 1700, 1725, and 1750 nm cavities with a repetition rate of 10 kHz and a pulse width of 30 ns (i.e., a duty ratio of 0.0003) of the pump source. Figure 2(a) demonstrates the measured output power with increasing the average pump power to a maximum of 3 W, and a linear evolution without saturation was obtained at the three wavelengths. The estimated threshold for the 1700, 1725, and 1750 nm lasers was, respectively, 1200, 900, and 700 mW, whereas the corresponding slope efficiency was around 32.5%. In principle, the enhanced reabsorption of light by the TDF at shorter wavelengths led to the increased cavity loss and lasing threshold, whereas the decreased quantum defect between the pump and laser photons at shorter wavelengths partly compensated that loss and resulted in a similar slope efficiency of the lasers. The obtained maximum output powers were, respectively, 582, 668, and 753 mW, corresponding to the single-pulse energy of 58.2, 66.8, and 75.3 μJ in view of the 10 kHz repetition rate. Figure 2(b) shows the recorded optical spectra of the lasers under the maximum pump power, and the results indicated that other than a small portion of the residual pump, the measured SNR of the lasers was higher than 57 dB with respect to the ASE at longer wavelengths. The spectrum of the 1725 nm laser was further zoomed in and is shown in the inset of Fig. 2(b), in which the 10 dB bandwidth was measured to be 0.1 nm.

Figure 2.(a) Output power evolution of the lasers with regards to the enhancement of the pump power. (b) Superimposed optical spectra of the gain-switched TDFLs at 1700, 1725, and 1750 nm under the maximum pump power of 3 W; inset: zoom-in spectrum of the 1725 nm laser.
With a light wave converter (Hewlett-Packard, 11982A) and a digital oscilloscope (Teledyne LeCroy, SDA8Zi-B), the temporal properties of the three lasers were characterized and demonstrated a similar behavior. Only the measurement results of the 1725 nm laser with maximum output power are given here for simplicity, as shown in Fig. 3. It is shown in Fig. 3(a) that there are multi-spikes on the pulse waveform owing to the onset of mode locking triggered by the high peak power () induced nonlinearities. To prove that these spikes would hardly affect the performance of the PA signal, which was sensed by a UT with a 10 MHz center response frequency in the current experiment, the detected electrical signal of the laser pulse was low-pass filtered (cutoff frequency 60 MHz) and is shown in Fig. 3(b). It is apparent that the spikes disappeared, and from the smooth waveform, a full width at half-maximum (FWHM) of 14 ns was obtained. Because the 60 MHz examining bandwidth corresponds to a minimum temporal resolution of 16.7 ns, it is more convincing to state a pulse width of . The small folding appeared at the pulse tail was attributed to the imperfection filtering. The pulse train over 1 ms provided in Fig. 3(c) verified the repetition rate of 10 kHz, and there were no parasitic pulses. Figure 3(d) presents the calculated histogram of around 2000 pulses, of which the corresponding pulse train is shown in the inset of Fig. 3(d). It is shown that there were no apparent intensity fluctuations over 0.2 s, and the pulse intensities distributed within a narrow range of the histogram. The ratio of standard deviation to the mean (std/mean) of the pulse intensities was calculated to be 1.92% over the recorded pulses. It is noted that owing to the temperature sensitivity of the FBGs, some degree of long-term power fluctuations induced by temperature change was observed. It would degrade the imaging quality when the scanning process takes a relatively long time, although this issue was not significant in the experiment that will be introduced later in this paper. To essentially address this problem, a temperature controlling system will be implemented to the laser cavity in the future work.
Figure 3.(a) Pulse waveform of the 1725 nm laser with maximum output power. (b) Pulse waveform, (c) pulse train over 1 ms, and (d) histogram of around 2000 pulses after 60 MHz low-pass filtering; inset of (d): corresponding pulse train over 0.2 s.
Before demonstrating PA imaging, the PAM system was characterized in terms of lateral and axial resolution by scanning (step size 2 μm) the edge of a black tape with a thickness of 100 μm. Owing to the high absorption efficiency of the black tape, the pulse energy was attenuated to 1 μJ before launching onto the sample. The captured PA signal was averaged 10 times and then its peak-to-peak intensity was used as the raw data of the scanning. As shown in Fig. 4(a), the raw data were fitted with the edge spread function (ESF), which was calculated with its first-order differential to yield the line spread function (LSF). The lateral resolution of the PAM was estimated to be 18.8 μm through acquiring the FWHM of the LSF. The deviation of the measured resolution from the theoretically calculated focusing beam size of was attributed to the imperfect focusing of the laser light by the OBJ that was originally designed for the visible band. The axial resolution was obtained by extracting the envelope of a single PA signal with Hilbert transformation, as depicted in Fig. 4(b), in which an axial resolution of 172.9 μm was obtained. Basically, the axial resolution is determined by the speed of sound (c) and the center response frequency of the UT (B), and it can be calculated as 0.88c/B, which produces a numerical number of 137.3 μm with and [23]. The slight discrepancy between the theoretical and experiment results might be caused by the specific size, structure, and shape of the sample that would affect the frequency characteristics of the PA signal [24]. One can find that here the major limitation to the axial resolution was the center response frequency of the UT, which could realize a better resolution with increasing the PA response frequency. Considering the laser pulse width of 16.7 ns (corresponding to a maximum PA signal frequency of 60 MHz), the achievable resolution was 22.9 μm. Nevertheless, owing to the increased attenuation of the PA signal at higher frequency, the system sensitivity and the imaging depth would be highly compromised when employing high-frequency detection. Therefore, to realize PAM imaging with desired axial resolution and sensitivity, a broadband transducer that covers the frequency range from several megahertz to tens of megahertz needs to be developed.
Figure 4.Measured (a) lateral and (b) axial resolution of the PAM system by scanning the edge of a black tape, of which the thickness is 100 μm.
By using the 1725 nm laser, PAM imaging was then demonstrated with a fat beef slice as the sample, as shown in Fig. 5(a). Because the sample was immersed in water, the pulse energy was adjusted to 10 μJ to compensate the water absorption and generate sufficient PA signal, which was 10 times averaged to increase the SNR. Figures 5(b) and 5(c), respectively, show the obtained three-dimensional (3D) imaging and maximum amplitude projection (MAP) imaging, through scanning the box section in Fig. 5(a) in orthogonal directions with a step size of 10 μm. The spatial lipid distribution of the sample was well resolved, and the imaging depth was measured to be around 1 mm, validating the volumetric imaging capability of the PAM system. The stripes in Fig. 5(c) are the imaging artifacts caused by the repeatability error of the employed scanning stage. The reason why the imaging was only demonstrated at 1725 nm is that the stepping rate of the employed scanning stage was too slow (maximum 2 Hz), resulting in a time-consuming scanning process, although the repetition rate of the laser pulse was high enough. In addition, the imaging quality of the volumetric PAM should not be related with the wavelength other than the contrast.
Figure 5.(a) Fat beef slice used for PAM imaging. (b) The obtained 3D imaging and (c) MAP imaging by scanning the box section in (a).
4. CONCLUSION
In conclusion, a high-energy all-fiber short wavelength gain-switched TDFL was demonstrated for volumetric PA imaging of lipids. The laser was realized with a linear DBR cavity constructed by a pair of FBGs that determines the operation wavelength. Three pairs of FBGs were employed to build cavities that lase at 1700, 1725, and 1750 nm and accordingly achieved pulse energies of 58.2, 66.8, and 75.3 μJ, respectively, at a repetition rate of 10 kHz with a maximum pump energy of 300 μJ at 1560 nm. A minimum pulse width of was obtained thanks to the short cavity length of . Through implementing a PAM system with the developed source, volumetric imaging of lipids was realized in a fat beef slice with a lateral resolution of 18.8 μm and an axial resolution of 172.9 μm. Although the wavelength tunability of the proposed laser scheme is limited by the FBGs, the demonstration of the three separate lasers with similar performance validates its capability for spectroscopically volumetric PAM of a lipid-rich sample.
References
[1] J. Workman, L. Weyer. Practical Guide and Spectral Atlas for Interpretive Near-Infrared Spectroscopy(2012).
[2] L. A. Sordillo, Y. Pu, S. Pratavieira, Y. Budansky, R. R. Alfano. Deep optical imaging of tissue using the second and third near-infrared spectral windows. J. Biomed. Opt., 19, 056004(2014).
[3] L. Shi, L. A. Sordillo, A. Rodríguez-Contreras, R. Alfano. Transmission in near-infrared optical windows for deep brain imaging. J. Biophoton., 9, 38-43(2016).
[4] D. C. Sordillo, L. A. Sordillo, P. P. Sordillo, R. R. Alfano. Fourth near-infrared optical window for assessment of bone and other tissues. Proc. SPIE, 9689, 96894J(2016).
[5] V. V. Alexander, K. Ke, Z. Xu, M. N. Islam, M. J. Freeman, B. Pitt, M. J. Welsh, J. S. Orringer. Photothermolysis of sebaceous glands in human skin ex vivo with a 1,708 nm Raman fiber laser and contact cooling. Lasers Surg. Med., 43, 470-480(2011).
[6] V. V. Alexander, Z. Shi, F. Iftekher, M. J. Welsh, H. S. Gurm, G. Rising, A. Yanovich, K. Walacavage, M. N. Islam. Renal denervation using focused infrared fiber lasers: a potential treatment for hypertension. Lasers Surg. Med., 46, 689-702(2014).
[7] I. Mingareev, F. Weirauch, A. Olowinsky, L. Shah, P. Kadwani, M. Richardson. Welding of polymers using a 2 μm thulium fiber laser. Opt. Laser Technol., 44, 2095-2099(2012).
[8] N. G. Horton, K. Wang, D. Kobat, C. G. Clark, F. W. Wise, C. B. Schaffer, C. Xu. In vivo three-photon microscopy of subcortical structures within an intact mouse brain. Nat. Photonics, 7, 205-209(2013).
[9] M. Yamanaka, T. Teranishi, H. Kawagoe, N. Nishizawa. Optical coherence microscopy in 1700 nm spectral band for high-resolution label-free deep-tissue imaging. Sci. Rep., 6, 31715(2016).
[10] Y. Li, J. Jing, E. Heidari, J. Zhu, Y. Qu, Z. Chen. Intravascular optical coherence tomography for characterization of atherosclerosis with a 1.7 micron swept-source laser. Sci. Rep., 7, 14525(2017).
[11] P. Wang, H. W. Wang, M. Sturek, J. X. Cheng. Bond-selective imaging of deep tissue through the optical window between 1600 and 1850 nm. J. Biophoton., 5, 25-32(2012).
[12] B. Wang, A. Karpiouk, D. Yeager, J. Amirian, S. Litovsky, R. Smalling, S. Emelianov. Intravascular photoacoustic imaging of lipid in atherosclerotic plaques in the presence of luminal blood. Opt. Lett., 37, 1244-1246(2012).
[13] M. Wu, K. Jansen, A. F. W. van der Steen, G. van Soest. Photoacoustic imaging of human coronary atherosclerosis in two spectral bands. Biomed. Opt. Express, 6, 3276-3286(2015).
[14] J. Hui, R. Li, E. H. Phillips, C. J. Goergen, M. Sturek, J. Cheng. Bond-selective photoacoustic imaging by converting molecular vibration into acoustic waves. Photoacoustics, 4, 11-21(2016).
[15] L. Li, J. Xia, G. Li, A. Garcia-Uribe, Q. Sheng, M. A. Anastasio, L. V. Wang. Label-free photoacoustic tomography of whole mouse brain structures ex vivo. Neurophotonics, 3, 035001(2016).
[16] J. Hui, Q. Yu, T. Ma, P. Wang, Y. Cao, R. S. Bruning, Y. Qu, Z. Chen, Q. Zhou, M. Sturek, J. Cheng, W. Chen. High-speed intravascular photoacoustic imaging at 1.7 μm with a KTP-based OPO. Biomed. Opt. Express, 6, 4557-4566(2015).
[17] Y. Li, X. Gong, C. Liu, R. Lin, W. Hau, X. Bai, L. Song. High-speed intravascular spectroscopic photoacoustic imaging at 1000 A-lines per second with a 0.9-mm diameter catheter. J. Biomed. Opt., 20, 065006(2015).
[18] M. Wu, G. Springeling, M. Lovrak, F. Mastik, S. Iskander-Rizk, T. Wang, H. M. M. van Beusekom, A. F. W. van der Steen, G. Van Soest. Real-time volumetric lipid imaging in vivo by intravascular photoacoustics at 20 frames per second. Biomed. Opt. Express, 8, 943-953(2017).
[19] Y. Cao, A. Kole, J. Hui, Y. Zhang, J. Mai, M. Alloosh, M. Sturek, J.-X. Cheng. Fast assessment of lipid content in arteries in vivo by intravascular photoacoustic tomography. Sci. Rep., 8, 2400(2018).
[20] T. Buma, N. C. Conley, S. W. Choi. Multispectral photoacoustic microscopy of lipids using a pulsed supercontinuum laser. Biomed. Opt. Express, 9, 276-288(2018).
[21] M. K. Dasa, C. Markos, M. Maria, C. R. Petersen, P. M. Moselund, O. Bang. High-pulse energy supercontinuum laser for high-resolution spectroscopic photoacoustic imaging of lipids in the 1650–1850 nm region. Biomed. Opt. Express, 9, 1762-1770(2018).
[22] 1.7 μm wavelength tunable gain-switched fiber laser and its application to spectroscopic photoacoustic imaging. Opt. Lett., 43, 5849-5852(2018).
[23] In vivo photoacoustic microscopy with 7.6-μm axial resolution using a commercial 125-MHz ultrasonic transducer. J. Biomed. Opt., 17, 116016(2012).
[24] Frequency analysis of the photoacoustic signal generated by coronary atherosclerotic plaque. Ultrasound Med. Biol., 42, 2017-2025(2016).


