We demonstrate a system for measuring the ocular axial length (AL) with high sensitivity and high speed using spectral-domain low-coherence interferometry (SD-LCI). To address the limit in measuring such a large range by using SD-LCI, we propose a full-range method to recognize the positive and negative depths. The reference arm length is changed synchronously with the shift of the focal point of the probing beam. The system provides a composite depth range that is sufficient to cover the whole eye. We demonstrate the performance of the presented system by measuring the ALs of five volunteers. This system can provide the A-scan ocular biometric assessment of the corneal thickness and AL in 0.1 s.
A cataract remains the world’s leading cause of blindness. Cataract surgery is the most common procedure performed by ophthalmic surgeons[1,2]. Accurate measurement of the ocular axial length (OAL) is essential for precisely calculating the intraocular lens (IOL) power[3,4]. Ultrasound-based axial length (AL) measurement has been the gold standard for many years. However, the ultrasound-based method is not a preferred clinical solution due to its numerous limitations, such as moderate resolution (approximately 200 μm), examiner dependence, patient’s discomfort, and the risk of corneal infection[5,6]. In recent years, optical methods based on low-coherence interferometry (LCI) [also referred as low-coherence reflectometry (LCR), optical coherence tomography (OCT), or partial coherence reflectometry (PCR)] have found their applications booming in ophthalmology[7–10]. The commercial optical instruments IOL Master 500 (Carl Zeiss Meditec Inc.) and Lenstar LS900 (Haag-Streit AG)[11–14] were based on time-domain interferometry. Then, Fourier-domain methods, including spectral-domain LCI (SD-LCI) and swept-source LCI (SS-LCI), were demonstrated by using a broadband light source and a spectrometer or by using a frequency swept light source and a high-speed detector[15–18]. Fourier-domain optical biometry has more advantages compared with time-domain optical biometry[19–21], such as higher sensitivity and higher speed. The more recently developed OA-2000 (Tomey GmbH) and IOL Master 700 (Carl Zeiss Meditec Inc.) are based on SS-LCI. One of the advantages of SS-LCI over SD-LCI is its reduced sensitivity drop-off, resulting in an enhanced depth range sufficient to cover the human AL. However, the SS-LCI-based instrument is expensive, which prevents its prevalence. In recent years, various SD-LCI-based methods for AL measurement have been reported[22–24]. The major advantage of SD-LCI is its relatively low cost. The average human AL is and ranges from to [25]. The limited depth range and complex conjugate artifact of SD-LCI hinder its application in measuring such a large range.
The depth range of standard SD-LCI is generally a few millimeters. The full-range OCT can double the depth range[26–31]. However, the technique increases the depth range by only a limited amount. Grajciar et al. used two separate reference arms to measure the human axial eye length[32]. Ruggeri et al. performed imaging and biometric measurement of the human eye by using an SD-OCT system with three reference arms[33]. Theoretically, the multi-reference-arm scheme can extend the depth range of standard SD-LCI, and one can measure a large range by separating it into multiple short segments. However, the multi-reference-arm scheme is impractical because ambiguous depth interpretation to each short segment could occur due to the complex conjugate artifact inherent to SD-LCI. A reconstructed A-scan image of SD-LCI is symmetrical about the zero delay line. This is because the Fourier transform of a real valued function is Hermitian symmetric, and it produces a complex conjugate artifact that mirrors the desired true image about the zero delay line. Consequently, the negative and positive depths cannot be distinguished from each other. Therefore, one must limit the sample under test entirely within the positive or negative depth range to avoid the ambiguous depth interpretation. The reported multi-reference-arm schemes for AL measurement are also limited by this problem. In full-range OCT, the negative and positive depths can be corrected by introducing a constant modulation frequency into each B-scan[26–29]. However, this method is not suitable for AL measurement, in which the A-scan is implemented.
Here, we propose a method to eliminate the ambiguous depth interpretation in A-scan SD-LCI, and present a SD-LCI-based system for AL measurement. In the system, a method for calculating the true depth and a reference arm switch are established to address the limits mentioned above. We distinguish between the negative and positive depths by comparing their absolute values measured using two different reference arm lengths (RALs). The reference arm switch changes the RAL synchronously with the shift of the focal point of the probing beam, providing a composite depth range that is sufficient to cover the AL. We demonstrate the performance of the presented system by measurement of the human AL.
Sign up for Chinese Optics Letters TOC. Get the latest issue of Chinese Optics Letters delivered right to you!Sign up now
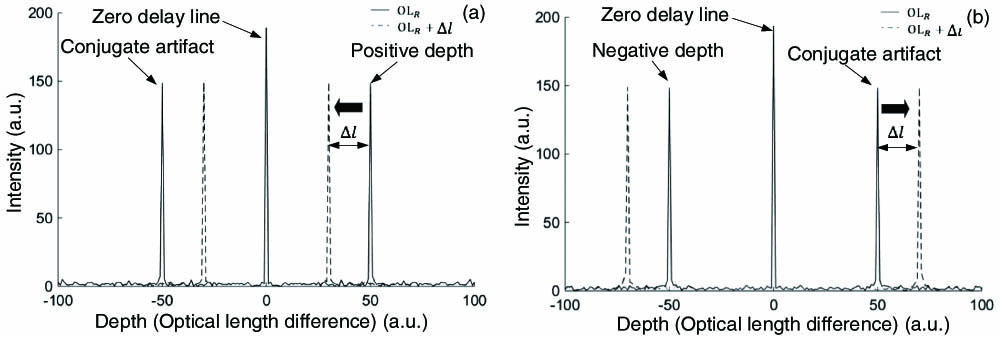
For convenience, we illustrate the method for recognizing the true depth using a sample with a single reflector. The spectral interferogram for one reflector can be written as[34]where represents the spectral intensity profile of the laser source, is the optical wavenumber, is the refractive index (here, supposing ), denotes the depth, and and represent the light intensity reflected from the reference and probe arms, respectively. The absolute value of the depth can be calculated by taking the Fourier transform of the spectral interferogram. To recognize the true depth of the reflector, two spectral interferograms are acquired with two different RALs and , respectively, where . In this study, the depth, i.e., the optical length difference between the probe and reference arms, is defined as , where represents the probe arm length. The simulation results are shown in Fig. 1, where the solid line and dashed line represent the results that are measured with RALs of and , respectively. Figures 1(a) and 1(b) show the results of a positive depth () and a negative depth (), respectively. As shown in Fig. 1(a), for the case of a positive depth, when the RAL increases from to , the absolute value decreases from to . In contrast, for the case of a negative depth, the absolute value increases from to when the RAL increases from to , as shown in Fig. 1(b). Hence, the negative and positive depths can be identified by comparing their absolute values that are measured with two different RALs. When increasing the RAL, the absolute value of a positive depth will decrease, while that of a negative depth will increase.
Figure 1.Schematic of recognition of (a) positive and (b) negative depths.
The schematic of the experimental setup is shown in Fig. 2(a). The light source is a superluminescent diode (SLD) with a central wavelength of 820 nm and a spectral bandwidth of 50 nm. The light emitted from the SLD is transmitted into the reference and probe arms by a single-mode fiber coupler. The spectral interferograms are acquired by a home-made spectrometer, primarily including a transmission grating (1800 lines/mm, Wasatch Photonics) and a line scan camera (spL2048-140 km, Basler). The collimated probe beam (PB) is first split into two light beams, (red solid line) and (blue solid line), by a non-polarizing beam splitter (). The two light beams are combined again by . The two PBs are focused around the cornea and the retina surface, respectively. separates the collimated reference beam (RB) into two sub-beams, (red dotted line) and (blue dotted line). The two sub-beams are switched synchronously with the shift of the focal point of the PB, providing a composite depth range that is sufficient to cover the whole eye.
Figure 2.(a) Schematic of the experimental setup. (b)–(d) Schematics of the rotating disk: (b) No reference and probe beams travel through the disk; (c) probe beam and reference beam travel through windows and , respectively; (d) probe beam and reference beam pass through windows and , respectively. SLD, super-luminescent diode; FC, fiber coupler; C, collimator; NPBS, non-polarizing beam splitter; L, lens; M, mirror; RD, rotating disk; TG, transmission grating; SM, servo motor; FT, fixation target; DM, dichroic mirror; PB, probing beam; RB, reference beam; W, optical window.
In the presented system, the reference arm switch and focal point shift are achieved by using a perforated rotating disk with holes and optical windows (W). The disk is driven by a servo motor. A front view of the disk is shown in Figs. 2(b)–2(d). and are incident nearly perpendicularly on the disk at points and , respectively. The opaque area of the disk is colored with gray, and the white holes denote the optical Ws the PB and RB can pass through. When rotating the disk, each W allows the light beam that is located on the same concentric circle (dashed circles) to pass through the disk. and provide channels for and to travel through the disk, respectively. Likewise, and allow and to pass through, respectively. is separated into two small , and , and is separated into and . Both and are mounted with a coverslip, providing an optical path increment of relative to and . The disk switches the two RBs and the two PBs to perform the measurement of the cornea and retina surfaces. Each combination is designed to optimize the interferometric signal collected from the cornea or the retina surface. In Fig. 2(b), both the RBs and PBs are blocked by the disk. When the disk is rotated to the position, as shown in Figs. 2(c) and 2(d), travels through and is focused around the cornea. In the meantime, successively travels through [Fig. 2(c)] and [Fig. 2(d)], and two sets of spectral interferograms are acquired to calculate the true depth of the cornea. Each set includes 50 spectral interferograms, and averaging is conducted to improve the signal-to-noise ratio (SNR). Then, passes through and is focused around the retina surface. , meanwhile, successively passes through and . Also, similar data collection is conducted to calculate the true depth of the retina surface. Automatic data processing and recognition of the true depth were performed by MATLAB.
Before starting the measurement, the optical path differences between and were precisely calibrated, and they were used to calculate the AL as follows: where and represent the optical depths of the cornea and retina, respectively, and is the optical offset between the two reference arms.
Considering the different refractive power of the subject under test, before starting the measurement, the position of the focusing lens [Fig. 2(a)] was adjusted with the aid of the fixation target that is located on the focal plane of [Fig. 2(a)]. Move along the optical axis until the fixation target can be clearly seen by the subject. This ensures that [Fig. 2(a)] is focused on the retina of the subject.
We first tested the present method for recognizing the positive and negative depths by using a glass slide with a thickness of approximately 1 mm. The results are shown in Fig. 3, where the dashed line and solid line denote the results when the reference light transmits through and , respectively. The impulse “A” denotes the interference result between the light reflected form the anterior and posterior surfaces of the glass slide, and the impulse “B” represents the interference result between the light reflected from the anterior and posterior surfaces of the coverslip, which is mounted on in order to increase the RAL. First, the glass slide was positioned in the positive depth range, i.e., the probe arm length was longer than the RAL. Figure 3(a) shows that the measured absolute values of the depths of the two surfaces of the glass slide decrease as the RAL increases. Next, the glass slide was moved into the negative depth range, i.e., the probe arm length was shorter than the RAL. As shown in Fig. 3(b), the absolute values of the depths of the two surfaces increase as the RAL increases. The experimental results are in agreement with the simulation results shown in Fig. 1. Then, the zero delay line was positioned between the anterior and posterior surfaces of the glass slide, and the results are shown in Fig. 3(c). When increasing the RAL, the absolute value of the depth of surface 2 decreases, and the absolute value of the depth of surface 1 increases. Thus, it can be determined that surface 1 and surface 2 are in the negative and positive depth ranges, respectively.
Figure 3.Distinguishing between positive and negative depths. The glass slide is located in (a) positive and (b) negative depth ranges. (c) The zero delay line is positioned between the two surfaces of the glass slide.
We measured the ALs of five volunteers in vivo. The eyes under measurement were illuminated with an incident power of 650 μW, which is less than the safety standard for continuous illumination of an eye at this wavelength of 750 μW[35]. During measurement, the volunteers were asked to look into the fixation target, as shown in Fig. 2(a). When rotating the disk by one turn, the data for calculating the AL was collected. Representative results of the cornea and retina are shown in Figs. 4(a) and 4(b), respectively, and both of them are recognized to be located in the positive depth range.
Figure 4.Representative results of (a) cornea and (b) retina.
After the OALs were obtained, we calculated the geometrical ALs (GALs) using an average group refractive index of ocular media for the corresponding wavelength (820 nm) of 1.3540[36]. AL measurements on the five volunteers with an IOL Master 500 (Carl Zeiss Meditec Inc.) were also conducted as a control. IOL Master 500 is incapable of measuring the corneal thickness. So, we only compare the ALs measured with the two systems, as shown in Table 1. The maximum deviation and the average relative deviation are 0.45 mm and 1.9%, respectively. The results show a good agreement between the two systems.
Right Eye
Left Eye
Presented System
IOL Master
Presented System
IOL Master
Volunteer
CT
AL
AL
CT
AL
AL
1
0.47
23.64
23.19
0.47
24.66
24.67
2
0.52
25.15
25.24
0.52
24.94
24.50
3
0.53
25.88
26.04
0.54
25.58
25.38
4
0.50
25.15
24.80
0.50
24.85
24.90
5
0.55
24.89
24.87
0.55
24.83
24.62
Table 1. Experimental Results with the Presented System and with IOL Master 500 (mm)a
The above experimental results confirmed that the presented method can be used for measuring the human AL with high speed and high sensitivity. The entire range between the cornea and retina is separated into two segments. By switching the PBs and RBs with a rotating disk, the system is equivalent to two SD-LCI systems. For each segment, the maximum depth range is (including the negative and positive depth ranges), which is sufficient to cover the varying range clinically required.
Recognizing the negative and positive depths is crucial for the SD-LCI-based techniques. In the traditional SD-LCI-based techniques, the negative and positive depths cannot be distinguished from each other. So, only a short range can be measured because the reflector under test must be limited in the negative or positive depth range in advance. Theoretically, a large range can be separated into multiple short ranges and measured with multiple reference arms. However, it is impractical to limit each short range entirely in a negative or a positive depth range. The same problem also exists in the reported SD-LCI-based AL measurement[32]. In the presented system, the ambiguous depth interpretation is eliminated. This method can also be used for SS-LCI and other FD-LCI-based applications.
The failure rate of AL measurement is mainly dependent on the systematical sensitivity. In the present system, the probing beam is successively focused around the cornea and retina to improve the sensitivity. In Fig. 4, the posterior surface of the cornea can be clearly distinguished. In contrast, in the IOL Master 500 and the reported SD-LSI system[32], the posterior surface of the cornea was not visible. So, the presented system has a relatively higher sensitivity.
Compared with the currently widely used commercial time-domain LCI-based biometric instruments (IOL Master 500 and Lenstar LS900), the presented system reduces the time for one measurement from several seconds to 0.1 s. In such a short time, the influence caused by eye motion can be effectively minimized. The measurement speed of the presented system is mainly dependent on the rotation speed of the disk, and it can be further improved if the rotation system is optimized, such as increasing its rotation speed or making more Ws in the disk.
In this study, the ALs of the adult volunteers were between 23 and 26 mm. So, a fixed [shown in Eq. (2)] was used. For practical applications, a variable could offer high sensitivity. The high-sensitivity region around the zero delay line can be utilized for the imaging of retina surfaces by changing the RAL.
In conclusion, we demonstrated that an SD-LCI system can be used for AL measurement with high speed and high sensitivity. To address the problems related in measuring such a large range using SD-LCI, we proposed the method for calculating the true depth and established the system with multiple reference arms. The experimental results show good agreement between the presented system and the IOL Master 500. It is a potential tool for rapid ocular biometric measurement for clinical and research applications in ophthalmology. Moreover, the presented method to eliminate the ambiguous depth interpretation can also be used in other FD-LCI-based techniques, such as surface topography imaging and depth measuring.