
Lijun Ren, Yuansheng Liu, Kedi Zhong. Building Method of Semantic Map Based on Improved PFPN[J]. Laser & Optoelectronics Progress, 2022, 59(4): 0428002
- Laser & Optoelectronics Progress
- Vol. 59, Issue 4, 0428002 (2022)
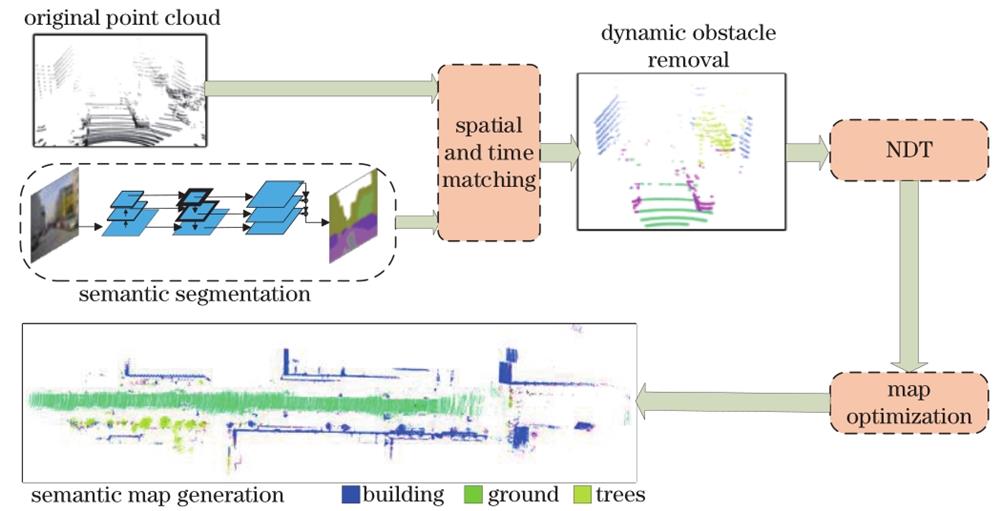
Fig. 1. Block diagram of semantic map construction
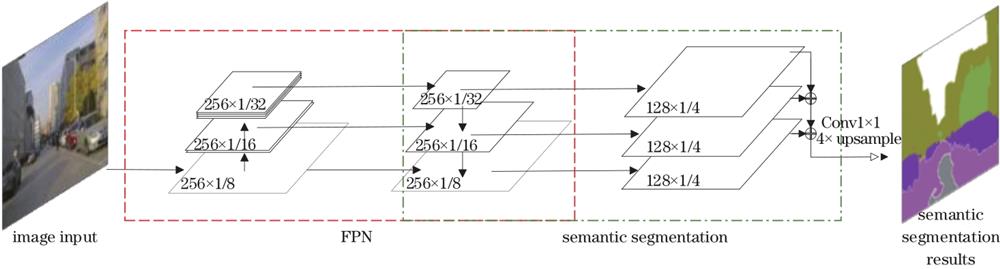
Fig. 2. Framework of PFPN semantic segmentation network
Fig. 3. Structure of reduced PFPN
Fig. 4. Schematic diagram of coordinate system
Fig. 5. Time matching method of Lidar and camera
Fig. 6. Fusion result
Fig. 7. Construction of semantic map
Fig. 8. Experimental test route and test environment. (a) Test route; (b) test environment
Fig. 9. Map comparison. (a) SLAM map established by original point cloud; (b) semantic map after removing vehicle information in environment; (c) (d) enlarged display of rectangular area in Fig. 9 (a),(b)
Fig. 10. Mapping track
Fig. 11. Error comparison between x-axis and y-axis
Fig. 12. Comparison of overall pose error
Table 1. Comparison of different methods
|
Table 2. Average number of point clouds per frame
|
Table 3. Comparison of average single registration time
|
Table 4. Average error analysis of key parameters

Set citation alerts for the article
Please enter your email address
© Copyright 2018-2021 | Chinese Laser Press. All Rights Reserved 沪ICP备15018463号-20