
Sheng Hu, Ling Yang, Min-Han Mi, Bin Hou, Sheng Liu, Meng Zhang, Mei Wu, Qing Zhu, Sheng Wu, Yang Lu, Jie-Jie Zhu, Xiao-Wei Zhou, Ling Lv, Xiao-Hua Ma, Yue Hao. Trap analysis of composite 2D–3D channel in AlGaN/GaN/graded-AlGaN:Si/GaN:C multi-heterostructure at different temperatures[J]. Chinese Physics B, 2020, 29(8):
- Chinese Physics B
- Vol. 29, Issue 8, (2020)
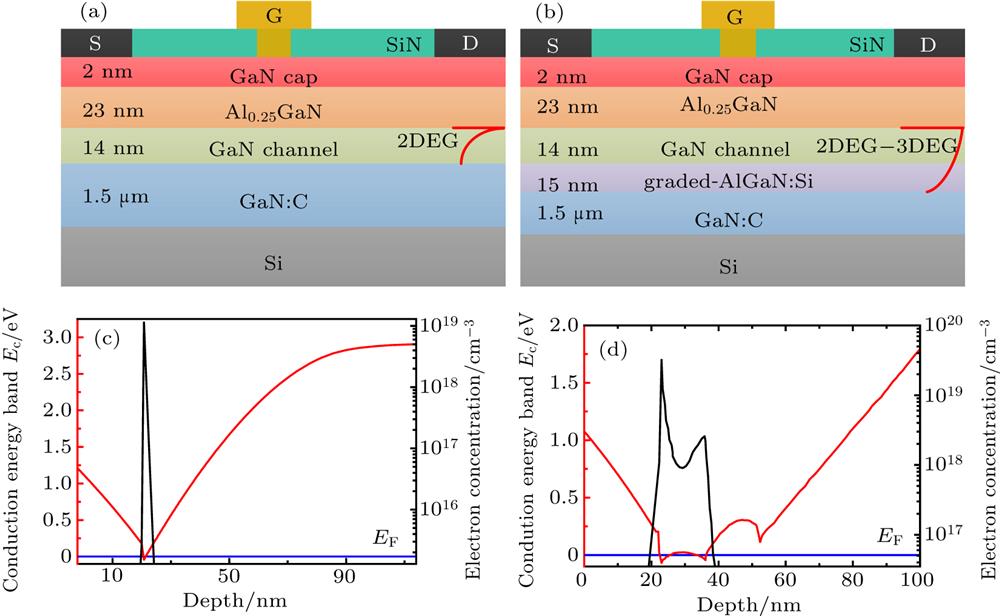
Fig. 1. Schematic cross-section of fabricated (a) SH:C and (b) DH:Si/C HEMT. Energy band diagram and electron distribution of (c) SH:C and (d) DH:Si/C.
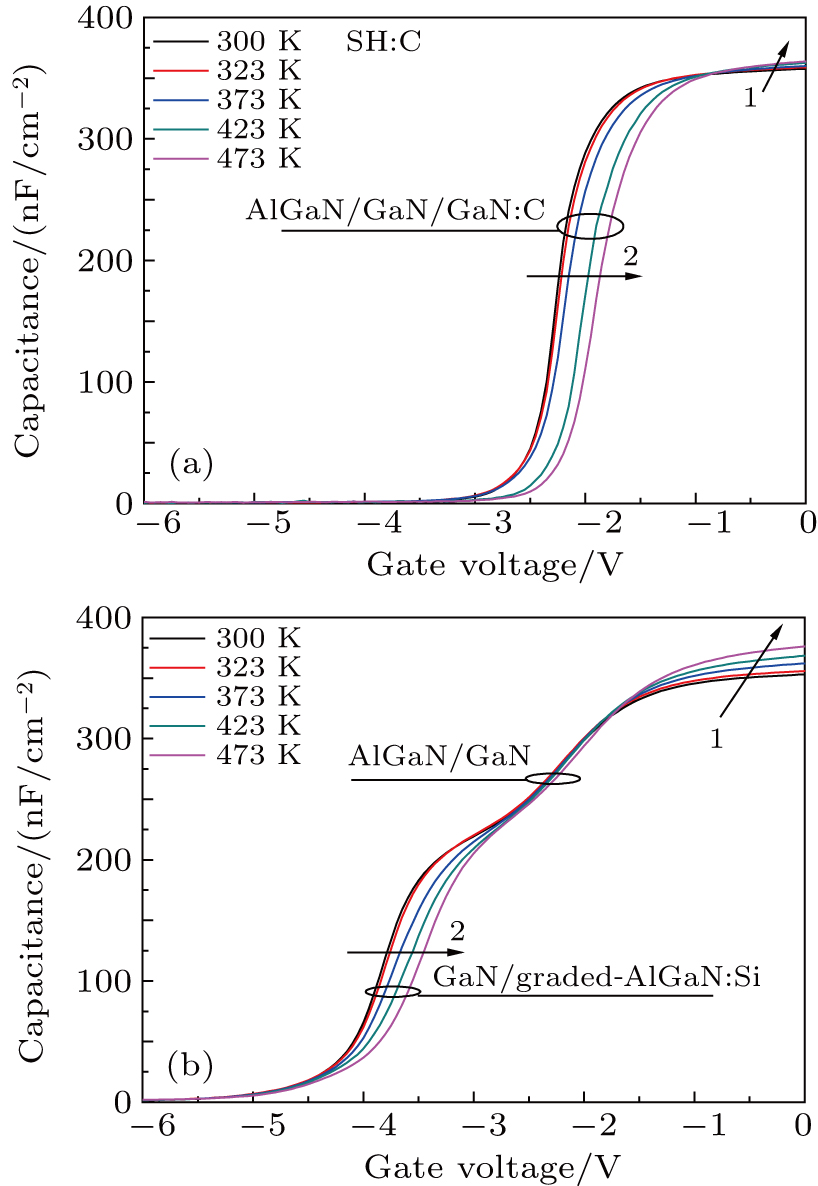
Fig. 2. C –V characteristics of (a) SH:C and (b) DH:Si/C with temperature increasing from 300 K to 500 K.
Fig. 3. Capacitance–voltage (C –V ) characteristics calculated the approximate charge density profiles of (a) SH:C and (b) DH:Si/C at different temperatures.
Fig. 4. Plots of conductance versus radial frequency for SH:C at (a) 300 K and (b) 500 K for some selected gate voltages, respectively.
Fig. 5. Plots of conductance versus radial frequency for DH:Si/C at (a) 300 K and (b) 500 K for some selected low gate voltages, and plots of conductance versus radial frequency at (c) 300 K and (d) 500 K for DH:Si/C at some selected high gate voltages.
Fig. 6. Plots of (a) time constant of trap state versus gate voltage and (b) trap state density versus trap state energy of SH:C and DH:Si/C.

Set citation alerts for the article
Please enter your email address
© Copyright 2018-2021 | Chinese Laser Press. All Rights Reserved 沪ICP备15018463号-20