Author Affiliations
1College of Materials Science and Engineering, South China University of Technology, Guangzhou, Guangdong 510640, China2State Key Laboratory of Luminescent Materials and Devices, South China University of Technology, Guangzhou, Guangdong 510640, Chinashow less
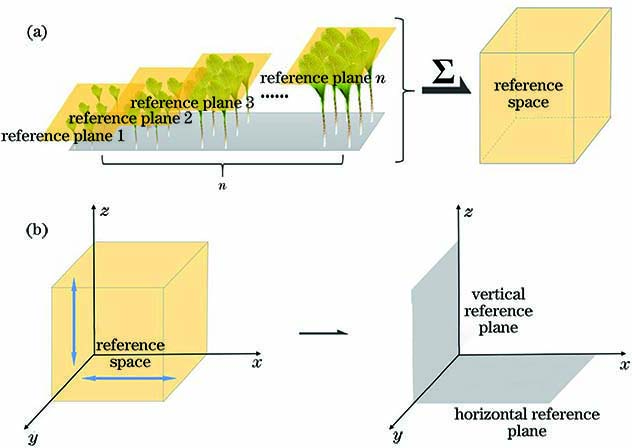
Fig. 1. Space uniformity theory. (a) Conversion of reference dimensions; (b) measurement of spatial uniformity
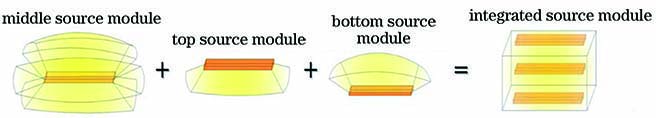
Fig. 2. Light mixing principle of three-light source module
Fig. 3. Structure of plant cultivation rack. (a) Plant culture rack structure; (b) plant culture rack section view; (c) plant culture rack section view and related parameters
Fig. 4. Structure of light source module 3
Fig. 5. S/N values corresponding to each factor level. (a) Illumination uniformity; (b) color-mixed uniformity
Fig. 6. Relationship of lighting quality and H. (a) Illumination uniformity; (b) color-mixed uniformity
Fig. 7. Final optimized results of culture rack on different sampling surfaces. Horizontal sampling plane (a) illuminance distribution; (b) light quality distribution; (c) chromaticity diagram; vertical sampling plane; (d) illuminance distribution; (e) light quality distribution; (f) chromaticity diagram
Fig. 8. Shape of LED chip. (a) I1; (b) I2; (c) I3; (d) I4; (e) I5
Fig. 9. Relationship between lighting quality and LED chip shape. (a) Illumination uniformity; (b) color-mixed uniformity
Fig. 10. Relationship between lighting quality and LED lamp bead spacing. (a) Illumination uniformity; (b) color-mixed uniformity
Fig. 11. Plant growth simulation test model
Fig. 12. Relationship between plant height and light source lighting quality. (a) Illumination uniformity; (b) color-mixed uniformity
Fig. 13. Physical test model
Code | Factor | Number of levels | Level 1 | Level 2 | Level 3 | Level 4 |
---|
A | h | 4 | 0.25 | 0.50 | 0.75 | 1.00 | B | s /mm | 4 | 12.5 | 25.0 | 37.5 | 50.0 | C | H /mm | 4 | 200 | 300 | 400 | 500 |
|
Table 1. Influencing factors and standards of plant cultivation racks
SerialNo. | A | B | C | Plane | Illuminationuniformity /% | Color-mixeduniformity /% | S/N ofilluminationuniformity | S/N ofcolor-mixeduniformity |
---|
1 | 1 | 1 | 1 | J | 89.664 | 89.616 | 38.856 | 39.047 | | | | | V | 51.307 | 90.529 | 34.203 | 39.135 | 2 | 1 | 2 | 2 | J | 93.479 | 86.415 | 39.414 | 38.712 | | | | | V | 81.128 | 81.634 | 38.183 | 38.237 | 3 | 1 | 3 | 3 | J | 94.528 | 82.221 | 39.511 | 38.299 | | | | | V | 89.887 | 90.246 | 39.073 | 39.108 | 4 | 1 | 4 | 4 | J | 92.561 | 85.547 | 39.329 | 38.644 | | | | | V | 90.780 | 85.135 | 39.160 | 38.602 | 5 | 2 | 1 | 2 | J | 91.889 | 90.000 | 39.265 | 39.085 | | | | | V | 84.705 | 85.091 | 38.558 | 38.597 | 6 | 2 | 2 | 1 | J | 89.511 | 87.775 | 39.037 | 38.864 | | | | | V | 81.146 | 86.989 | 38.185 | 38.789 | 7 | 2 | 3 | 4 | J | 94.247 | 86.148 | 39.485 | 38.704 | | | | | V | 95.109 | 87.517 | 39.564 | 38.841 | 8 | 2 | 4 | 3 | J | 90.884 | 88.457 | 39.169 | 38.935 | | | | | V | 92.917 | 88.414 | 39.362 | 38.930 | 9 | 3 | 1 | 3 | J | 89.201 | 85.538 | 39.007 | 38.643 | | | | | V | 88.052 | 88.658 | 38.895 | 38.954 | 10 | 3 | 2 | 4 | J | 93.039 | 87.947 | 39.373 | 38.884 | | | | | V | 92.983 | 89.999 | 39.368 | 39.084 | 11 | 3 | 3 | 1 | J | 91.629 | 88.242 | 39.241 | 38.913 | | | | | V | 84.265 | 83.350 | 38.513 | 38.418 | 12 | 3 | 4 | 2 | J | 92.176 | 88.221 | 39.292 | 38.911 | | | | | V | 92.357 | 81.416 | 39.309 | 38.214 | 13 | 4 | 1 | 4 | J | 92.142 | 87.449 | 39.289 | 38.835 | | | | | V | 89.295 | 86.281 | 39.016 | 38.718 | 14 | 4 | 2 | 3 | J | 91.665 | 81.694 | 39.244 | 38.244 | | | | | V | 92.667 | 86.433 | 39.338 | 38.733 | 15 | 4 | 3 | 2 | J | 91.642 | 80.662 | 39.241 | 38.133 | | | | | V | 88.566 | 88.071 | 38.945 | 38.897 | 16 | 4 | 4 | 1 | J | 91.543 | 87.546 | 39.232 | 38.845 | | | | | V | 88.769 | 84.271 | 38.965 | 38.513 |
|
Table 2. Experimental design parameters using L16(45) orthogonal table
Code | Horizontal plane /% | Vertical plane /% |
---|
A | 11.72 | 28.22 | B | 46.03 | 29.18 | C | 43.11 | 42.59 |
|
Table 3. Contribution rate of each factor to illumination uniformity
Code | Horizontal plane /% | Vertical plane /% |
---|
A | 34.73 | 5.54 | B | 35.19 | 29.96 | C | 30.07 | 64.49 |
|
Table 4. Contribution rate of each factor to color-mixed uniformity
Condition | Plane | Physical test result | Simulation result |
---|
Illumination uniformity /% | J | 87.38 | 91.35 | | V | 84.09 | 89.71 | Color-mixed uniformity /% | J | 86.26 | 87.67 | | V | 86.89 | 88.54 |
|
Table 5. Comparison of physical test results and simulation results