
Lei Wang, Meiting Wang, Luwei Wang, Xiaomin Zheng, Jiajie Chen, Wenshuai Wu, Wei Yan, Bin Yu, Junle Qu, Bruce Zhi Gao, Yonghong Shao. Stimulated emission–depletion-based point-scanning structured illumination microscopy[J]. Chinese Optics Letters, 2024, 22(3): 031701
- Chinese Optics Letters
- Vol. 22, Issue 3, 031701 (2024)
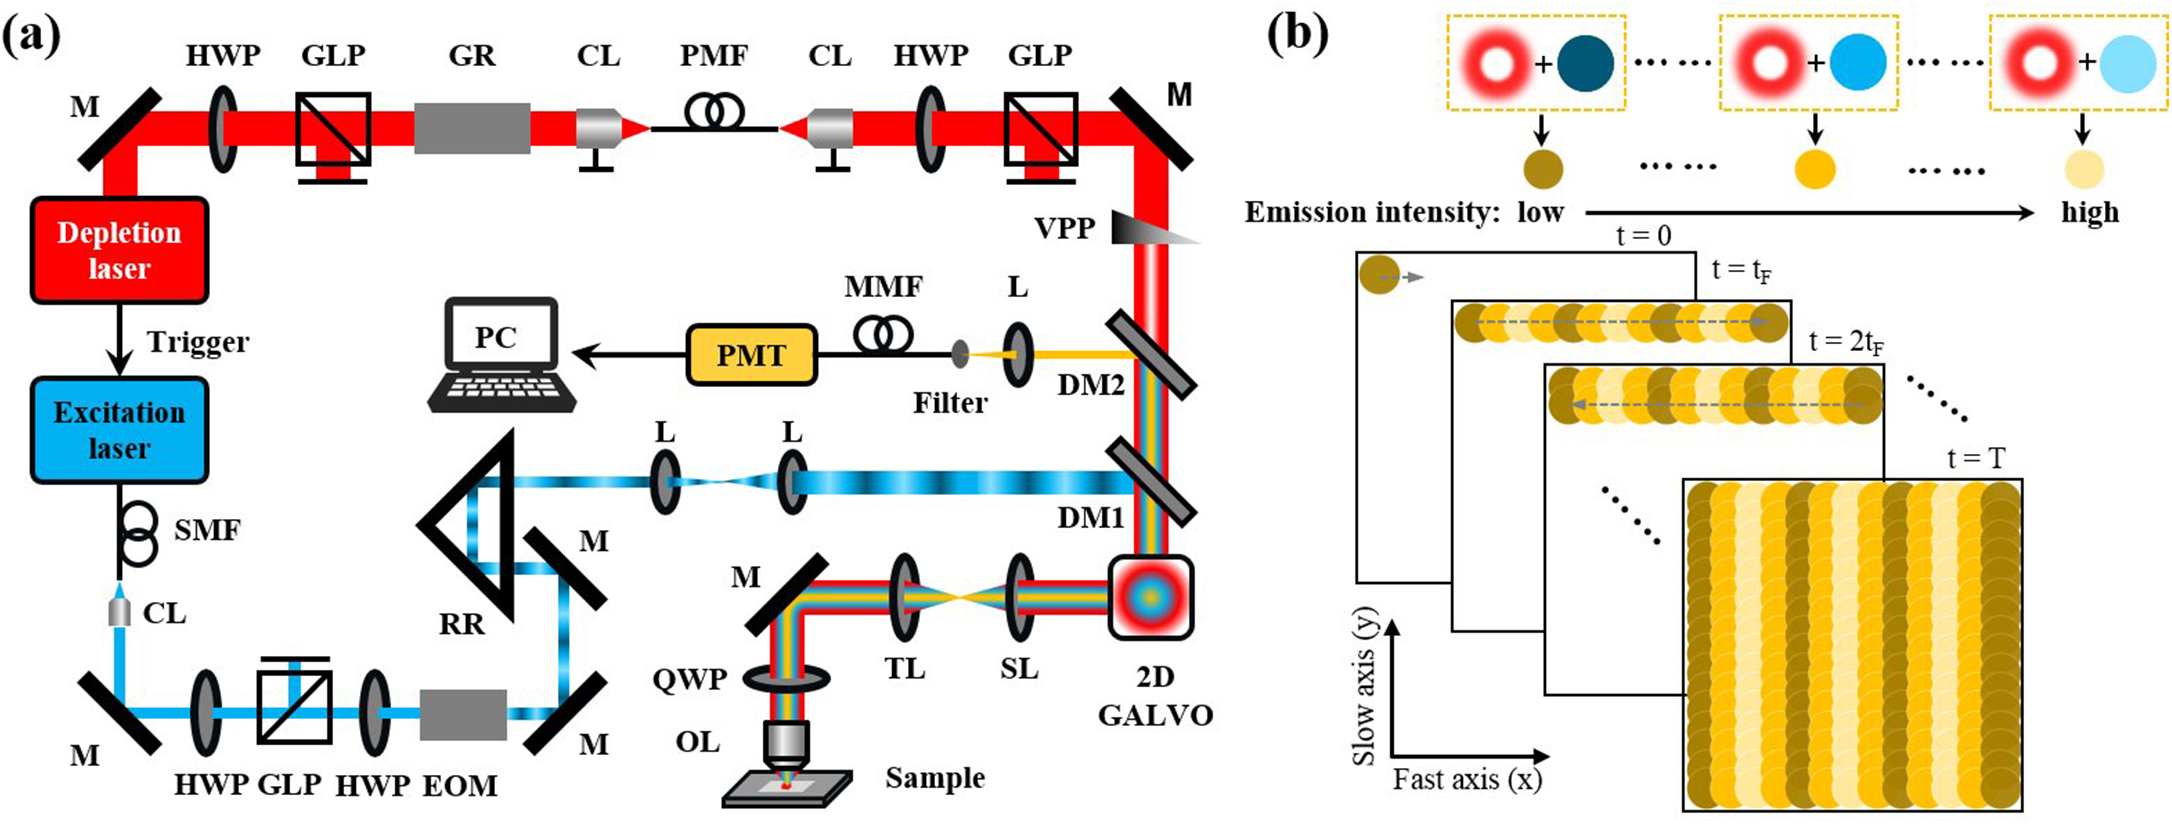
Fig. 1. (a) Schematic diagram of STED-psSIM; (b) relationship among the excitation beam, the depletion beam, and the fluorescence signal in the temporal and spatial domain.
![Comparison of imaging resolutions of confocal microscopy, STED microscopy, and STED-psSIM. (a) Images of 23 nm fluorescent beads captured by the confocal microscopy (lower left), STED microscopy (middle), and STED-psSIM (upper right) separated by a dashed green line; (b)–(d) magnified view of the area encircled by the green dashed box in (a): (b) confocal microscopy, (c) STED microscopy, and (d) STED-psSIM[28]; (e)–(g) observable spatial frequency regions obtained by Fourier transforming images in (b)–(d); (h), (i) normalized intensity profiles of fluorescence beads along the (h) blue and (i) yellow dashed lines in (b)–(d), respectively. The profiles show average FWHMs of 193, 117, and 74 nm. Scale bars, 1 µm in (a) and 0.2 µm in (b)–(d).](/richHtml/col/2024/22/3/031701/img_002.jpg)
Fig. 2. Comparison of imaging resolutions of confocal microscopy, STED microscopy, and STED-psSIM. (a) Images of 23 nm fluorescent beads captured by the confocal microscopy (lower left), STED microscopy (middle), and STED-psSIM (upper right) separated by a dashed green line; (b)–(d) magnified view of the area encircled by the green dashed box in (a): (b) confocal microscopy, (c) STED microscopy, and (d) STED-psSIM[28]; (e)–(g) observable spatial frequency regions obtained by Fourier transforming images in (b)–(d); (h), (i) normalized intensity profiles of fluorescence beads along the (h) blue and (i) yellow dashed lines in (b)–(d), respectively. The profiles show average FWHMs of 193, 117, and 74 nm. Scale bars, 1 µm in (a) and 0.2 µm in (b)–(d).
Fig. 3. Resolution improvement in STED-psSIM for biological imaging. (a) Images of NPC and (b) labeled actin in huFIB cells captured by confocal microscope (lower left), STED (middle), and STED-SIM (upper right) separated by two dashed green lines; (c) and (e) magnified view of the area encircled by the dashed box in (a) and (b); (d) and (f) normalized intensity profiles along the green dashed lines in (c) and (e), respectively; (g) SBR of the two biological samples in the three methods. Scale bars, 1 µm in (a), (b), 0.4 µm in (c), and 0.2 µm in (e).

Set citation alerts for the article
Please enter your email address
© Copyright 2018-2021 | Chinese Laser Press. All Rights Reserved 沪ICP备15018463号-20