
Zhi-Xiang Li, Dong Zhu, Pei-Cheng Lin, Peng-Cheng Huo, Hong-Kuan Xia, Ming-Ze Liu, Ya-Ping Ruan, Jiang-Shan Tang, Miao Cai, Hao-Dong Wu, Chao-Ying Meng, Han Zhang, Peng Chen, Ting Xu, Ke-Yu Xia, Li-Jian Zhang, Yan-Qing Lu, "High-dimensional entanglement generation based on a Pancharatnam–Berry phase metasurface," Photonics Res. 10, 2702 (2022)
- Photonics Research
- Vol. 10, Issue 12, 2702 (2022)
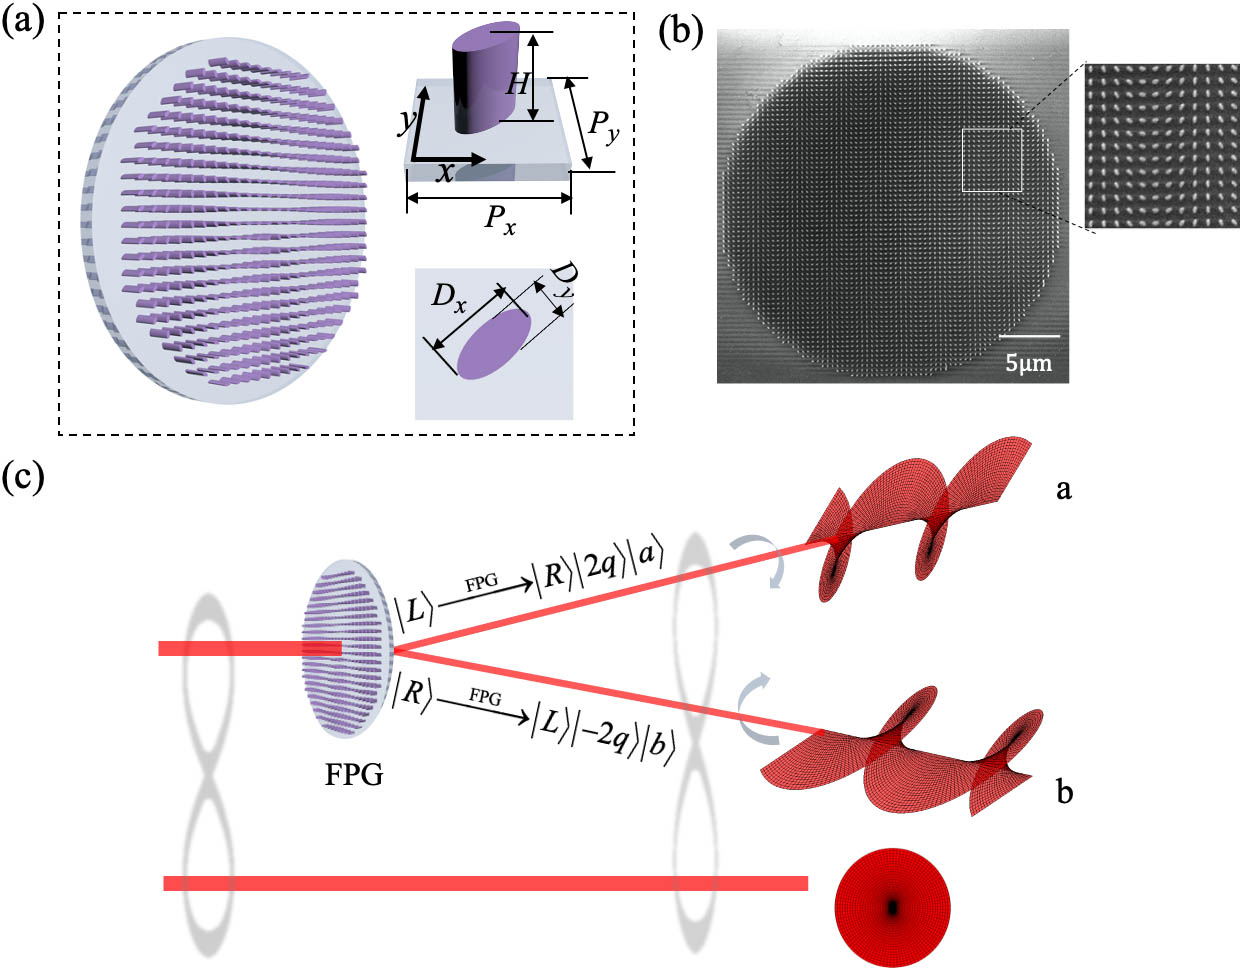
Fig. 1. (a) Schematic diagram of the proposed metasurface. The size of the spatially variant elliptic cylinders is D x = 210 nm D y = 100 nm H = 600 nm P x = P y = 400 nm
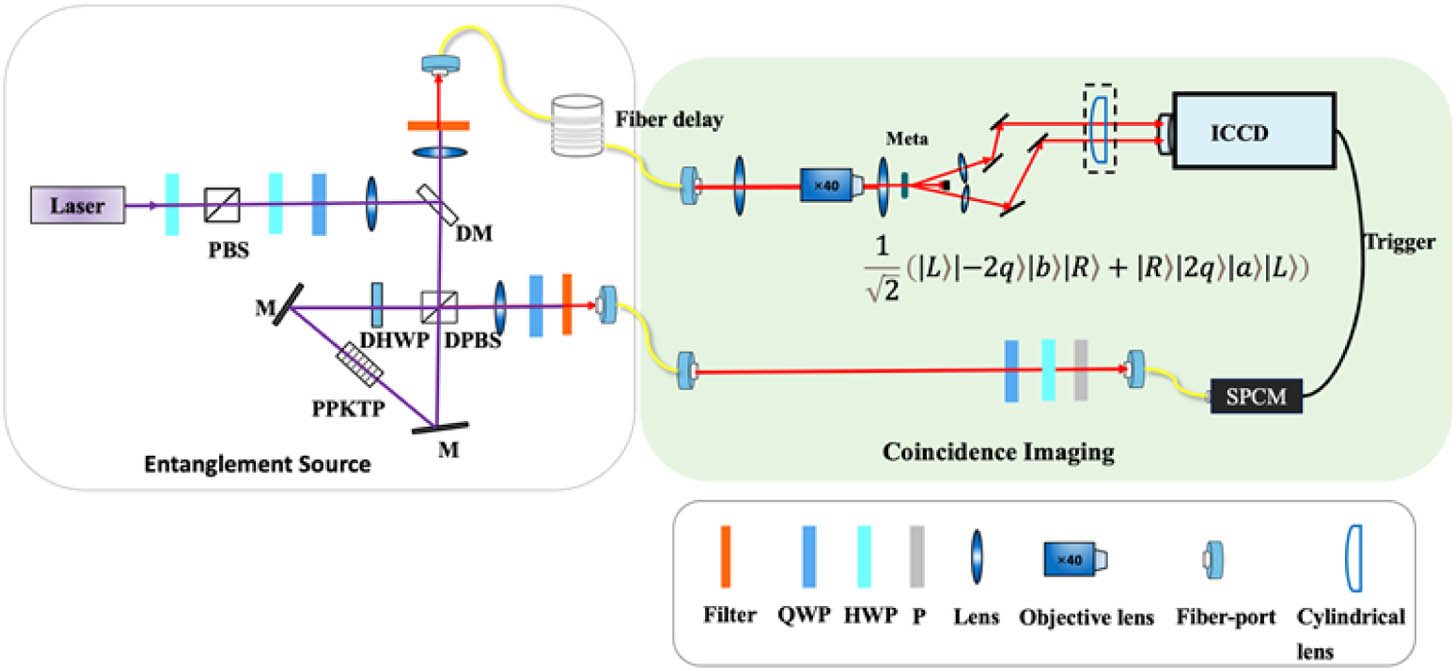
Fig. 2. Experimental setup to generate the entanglement and record the coincidence images. QWP, quarter-wave plate; HWP, half-wave plate; PBS, polarizing beam splitter; M, mirror; DM, dichroic mirror; DPBS, dual-wavelength PBS; DHWP, dual-wavelength HWP.
Fig. 3. Experimental results of the coincidence images. The first column tells Alice’s trigger polarization with which the images are recorded. R and L represent right- and left-handed circular polarization. The images with the path, topological charge, and polarization information acquired at Bob’s side depend on the trigger polarization. All images are given with a 99:1 contrast setting of the ICCD.
Fig. 4. (a) Real and imaginary parts of the reconstructed density matrix. (b) Experimental setup to perform the quantum state tomography.
Fig. 5. Numerically simulated polarization conversion efficiency based on the wavelength.
Fig. 6. Numerically simulated transmittance spectrum of the metasurface.
Fig. 7. Measured far-field diffraction intensity distributions of the metasurface. (a) Diffraction intensity distribution with a linearly polarized light incidence. (b) and (c) are the diffraction intensity distributions with R and L polarized incidence, separately. The results are obtained with a classical light source with a wavelength of 810 nm.
Fig. 8. Reconstructed density matrix of the original polarization entanglement state.


Set citation alerts for the article
Please enter your email address

© Copyright 2018-2021 | Chinese Laser Press. All Rights Reserved 沪ICP备15018463号-20