- Spectroscopy and Spectral Analysis
- Vol. 41, Issue 10, 3256 (2021)
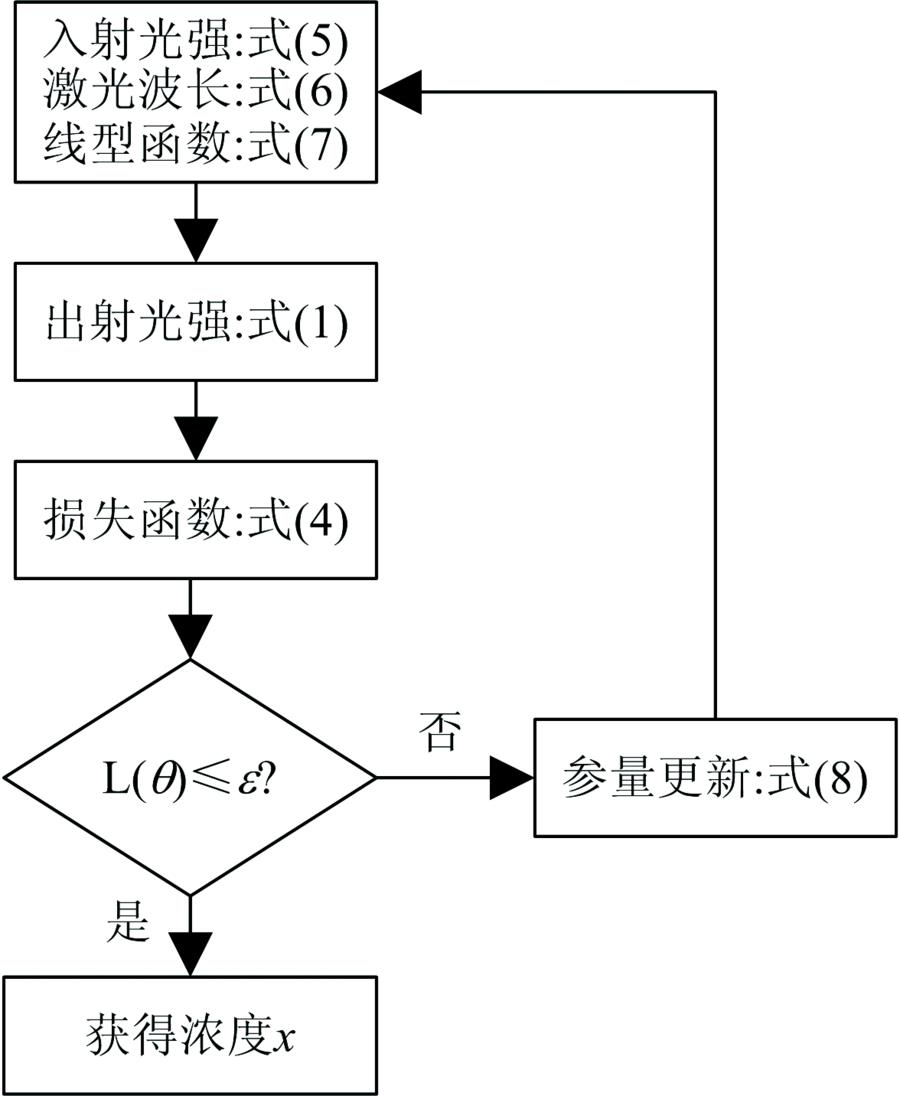
Fig. 1. Fitting flowchart
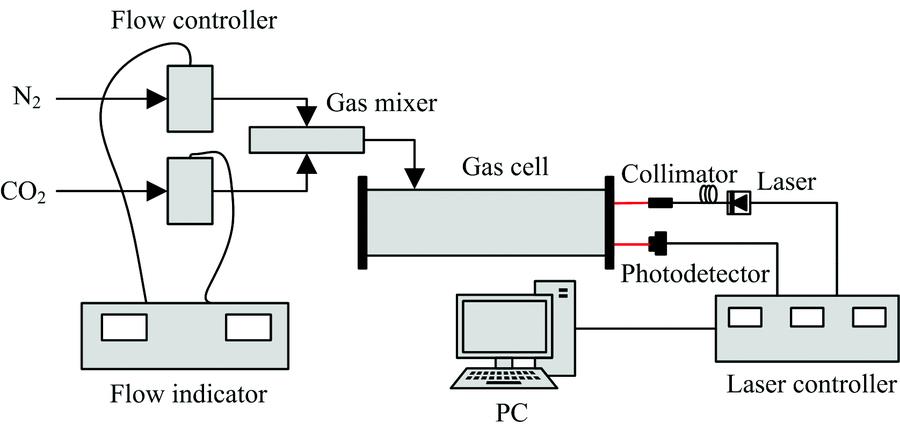
Fig. 2. Experimental system diagram
Fig. 3. Point selection for initial value calculation of incident laser intensity parameters
Fig. 4. Convergence speed of five step factors
Fig. 5. Fitting results at different concentrations
(a): 10%; (b): 12%; (c): 14%; (d): 16%; (e): 18%; (f): 20%
(a): 10%; (b): 12%; (c): 14%; (d): 16%; (e): 18%; (f): 20%
Fig. 6. Absorbance at different concentrations obtained by routine baseline fitting
|
Table 1. Spectral parameters of two absorption lines of CO2 around 1 580 nm (296 K)
|
Table 2. Analyze the results of direct fitting method and integral area method

Download Citation

Set citation alerts for the article
Please enter your email address
© Copyright 2018-2021 | Chinese Laser Press. All Rights Reserved 沪ICP备15018463号-20