• Spectroscopy and Spectral Analysis
  • Vol. 41, Issue 11, 3583 (2021)
Xiao-mei LIN1、*, Xiao-meng WANG1、1;, Yu-tao HUANG1、1; *;, and Jing-jun LIN2、2; *;
Author Affiliations
  • 11. Department of Electronics and Electrical Engineering, Changchun University of Technology, Changchun 130012, China
  • 22. Department of Mechanical and Electrical Engineering, Changchun University of Technology, Changchun 130012, China
  • show less
    DOI: 10.3964/j.issn.1000-0593(2021)11-3583-05 Cite this Article
    Xiao-mei LIN, Xiao-meng WANG, Yu-tao HUANG, Jing-jun LIN. PSO-LSSVM Improves the Accuracy of LIBS Quantitative Analysis[J]. Spectroscopy and Spectral Analysis, 2021, 41(11): 3583 Copy Citation Text show less
    Schematic diagram of the experimental system
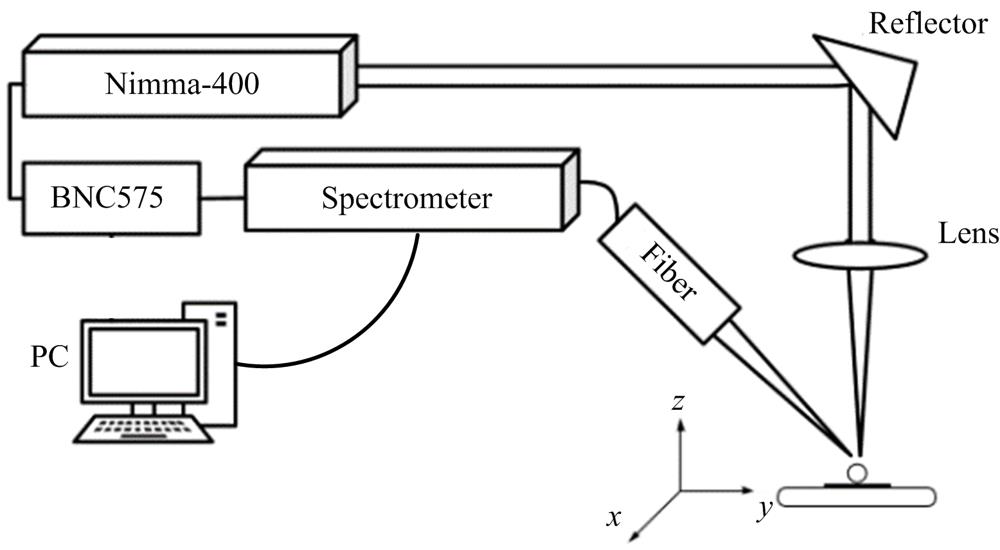
    Fig. 1. Schematic diagram of the experimental system
    Characteristic line distributions of Pb and Cr
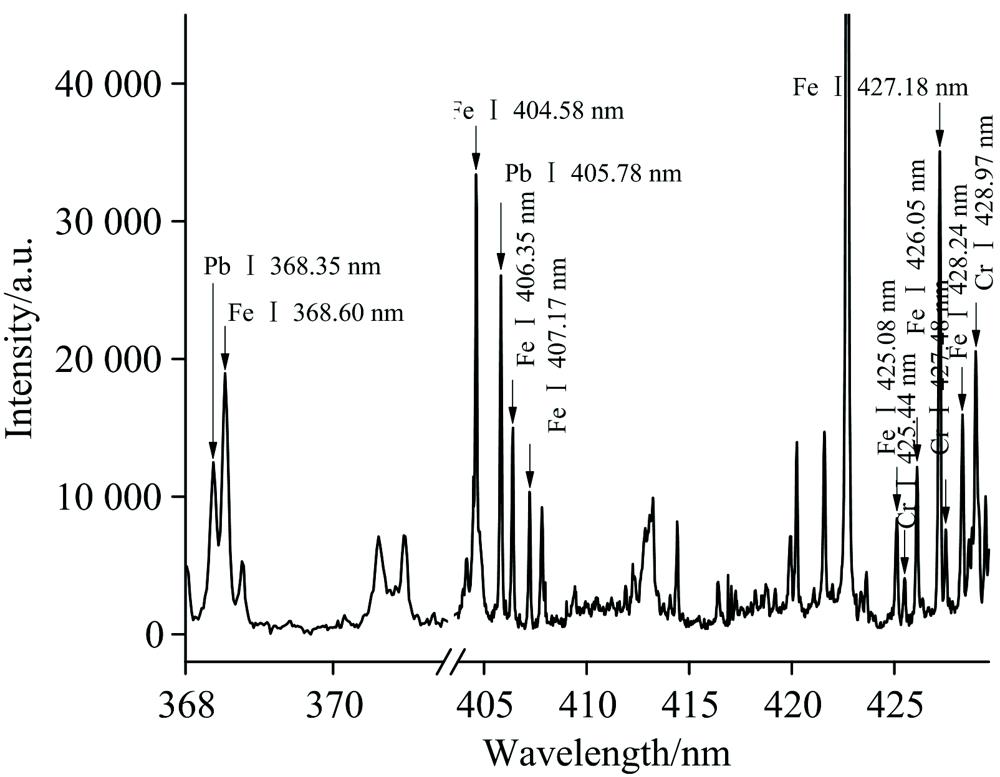
    Fig. 2. Characteristic line distributions of Pb and Cr
    Pb element calibration model based on LSSVM
    Fig. 3. Pb element calibration model based on LSSVM
    Cr element Calibration model based on LSSVM
    Fig. 4. Cr element Calibration model based on LSSVM
    Pb element calibration model based on PSO-LSSVM
    Fig. 5. Pb element calibration model based on PSO-LSSVM
    Cr element calibration model based on PSO-LSSVM
    Fig. 6. Cr element calibration model based on PSO-LSSVM
    Sample numberConcentration of Pb and Cr/Wt%
    10.02
    20.05
    30.1
    40.2
    50.3
    60.4
    70.5
    80.6
    90.7
    100.8
    110.9
    121.0
    Table 1. Certified concentration (Wt%) of Pb and Cr in the samples
    元素
    种类
    方法R2RMSEC
    /Wt%
    RMSEP
    /Wt%
    PbLSSVM0.922 30.026 00.101 8
    POS-LSSVM0.982 80.022 40.045 8
    CrLSSVM0.948 00.027 20.078 8
    POS-LSSVM0.985 00.019 10.042 0
    Table 2. LSSVM and PSO-LSSVM data comparison
    Xiao-mei LIN, Xiao-meng WANG, Yu-tao HUANG, Jing-jun LIN. PSO-LSSVM Improves the Accuracy of LIBS Quantitative Analysis[J]. Spectroscopy and Spectral Analysis, 2021, 41(11): 3583
    Download Citation