Abstract
A new approach is proposed to accurately determine the thickness of films, especially for ultra-thin films, through spectrum-fitting with the assistance of an interference layer. The determination limit can reach even less than 1 nm. Its accuracy is far better than that of the traditional methods. This determination method is verified by experiments, and the determination limit is at least 3.5 nm compared with the results of atomic force microscope (AFM). Furthermore, a double interference-aided spectra fitting method is proposed to reduce the requirements of the determination instruments, which thus allows one to determine the film’s thickness with a low-precision common spectrometer and to greatly lower the cost. It is a very high-precision determination method for on-site and in-situ applications, especially for ultra-thin films.Nowadays, ultra-thin films are widely used in optical and electronic devices. Gate dielectric films less than 5.0 nm thick are becoming common in metal oxide semiconductor (MOS) technology[1]. Aluminum-doped zinc oxide (AZO) ultra-thin films of about 10.0 nm play important roles in low-e glasses[2]. The photoelectric properties of single- and multi-layer have been intensively studied for their vast potential applications[3]. Uniformity analysis is helpful for the large-area nanoscale thin films being produced[4]. It is especially important for optical thin films and will influence their optical property largely. Thus, ultra-thin film thickness determination, especially for measurements and controlling in the deposition process, is very important in industry and research fields. There are three main thickness determination methods for in-situ situation: the quartz crystal oscillation method[5], the ellipsometry method[6], and the photometric method[7,8].
The quartz crystal oscillation method is a good physical thickness monitoring method only when the coating parameters are stable and there is a small mass load. It is not a kind of accurate thin-film monitoring method when the process parameters appear to fluctuate. Furthermore, the quartz crystal oscillation method cannot monitor the optical thickness and control the optical property of the film. In order to monitor the optical thickness accurately, the ellipsometry method and photometric method were proposed. The former is very sensitive with film thickness changes, which makes it a good candidate for thickness measurements of ultra-thin films[9]. However, the ellipsometry system is complicated and cannot use fiber to ensure the polarization property, which increase the difficulty for in-situ applications and increases the cost. The photometric spectrum is the main in-situ method for the detection and monitoring of film thicknesses up to now[10].
The photometric method is a single-wavelength monitoring method and outstanding when the film thickness is comparable to or thicker, where is the monitoring wavelength. For the photometric spectrum (transmission or reflection spectra), spectral curves are easily calculated from the optical constants and the thickness of the material through the transfer-matrix method[11]. The optical constants and thickness can be fitted by some proper algorithms, such as the genetic algorithm[12] and the annealing algorithm[13]. Our predecessors spent a lot of time building the models[14] of the optical constants and optimizing the algorithms. These efforts have greatly improved the accuracy of thickness and index measurements. However, the calibration precision of the thickness is not only affected by the fitting procedure, but it is also determined by the amount of information the spectrum contained and remarkably influenced by the precision of the spectral obtaining process. When the thickness of film is very thin (generally smaller than 90 nm), the change of spectra with and without it is very small and no obvious characteristic spectral structure information exists, leading to the difficulty of fitting and determining accurately. Furthermore, it is almost impossible to distinguish the film when its refractive index is close to that of the substrate. Therefore, there is no suitable method for accurate thickness in-situ determination of films thinner than 90 nm.
Sign up for Chinese Optics Letters TOC. Get the latest issue of Chinese Optics Letters delivered right to you!Sign up now
We present an interference-aided spectrum-fitting method to determine film thicknesses accurately with the help of an interference layer whose determination limit can be extended to even less than 1 nm. Furthermore, double interference-aided spectra fitting simultaneously are introduced to lower the requirement for the equipment’s resolution.
All simulation and fitting processes in this work were carried out by CODE 3.27 of W. Theiss Hard and Software.
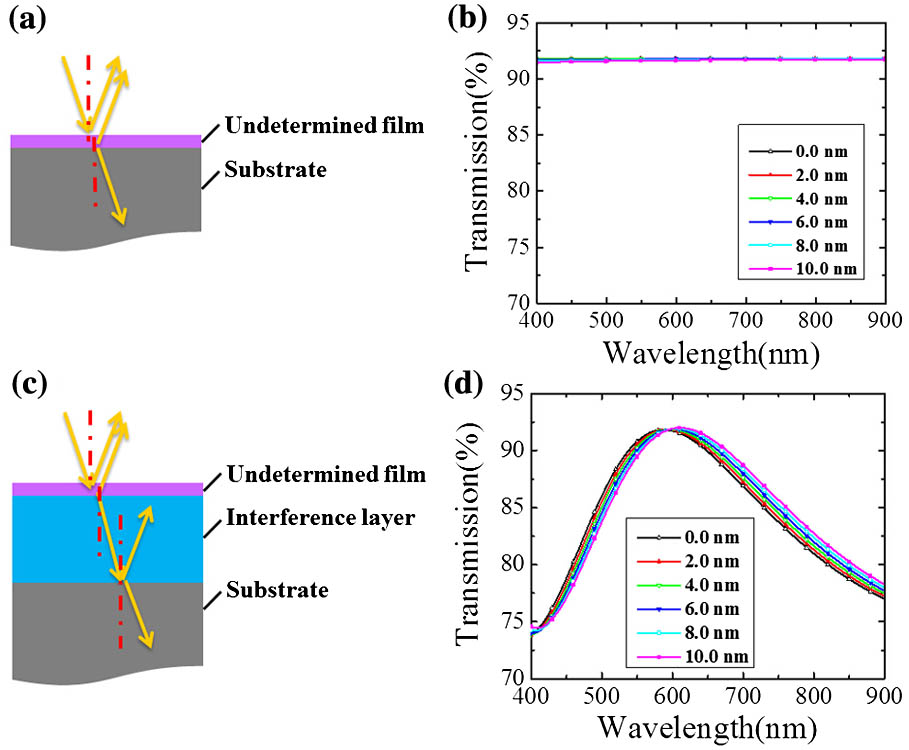
The structure of the traditional fitting method is presented in Fig. 1(a). The undetermined film is deposited on the substrate directly in the traditional method, and then its spectrum has been fitted to determine its thickness. This method is valid when the thickness of the undetermined film is comparable to the wavelength or thicker and the refractive index of undetermined film is quite different from the substrate. But it will lead to significant errors when the film thickness is far less than the wavelength, because only small spectral intensity changes exist, as shown in Fig. 1(b), especially when the refractive index of the film is close to that of the substrate. The refractive indexes of the substrate and undetermined film were set as 1.52 and 1.70 in the simulation. Meanwhile, the thickness of the substrate was set as 1.0 mm. Slight changes in the intensity caused by undetermined films can be observed in the traditional method in Fig. 1(b). For example, the transmittance decreases only 0.2% to 91.7% at the wavelength of 400 nm when thickness of undetermined film is 6.0 nm. The transmittance is 91.5% when it is 10.0 nm, which means the intensity change is only about 0.4%. Such a small transmittance change is due to the lack of enough information to determinate the thickness accurately, and it is easily influenced by the light source and external environment.

Figure 1.Structure diagram of (a) traditional method and (c) interference-aided spectrum-fitting method. Simulated transmission spectra of (b) traditional method and (d) interference-aided spectrum-fitting method with different thickness undetermined films.
To solve this problem, we propose an interference-aided spectrum-fitting method by introducing an interference layer onto the substrate, as Fig. 1(c) shows. The interference layer is thick enough to generate an interference effect in the transmission or reflection spectra when its refractive index is different from the substrate, as shown in Fig. 1(d). The refractive index and thicknesses of the interference layer was set as 2.10 and 140.0 nm, respectively, in the simulation. The parameters of the other layers were set the same as the previous description. The transmittance increased from 73.9% to 74.6% at the wavelength of 400 nm when 10.0 nm undetermined film was coated on, corresponding to intensity change of 0.9%, 2 times larger than that of the traditional method. The peak position of 588.0 nm resulted from the interference layer moving to 610.8 nm. The position change is 22.8 nm and as high as 3.9%, almost 10 times the intensity change of the traditional method. Therefore, in addition to a more obvious intensity change, a much larger change of peak can be observed with the aid of the interference layer. The peak shift of 4.6 nm can still be obviously observed with only 2.0 nm of undetermined film, as Fig. 1(d) shows. More importantly, the peak position is almost only determined by film properties such as the thickness and refractive index, and it is rarely affected by the measuring system and environment. Thus, the information contained, and the reliability of the peak position measurement is much higher than that of intensity measurement, resulting in further improvement of the determination accuracy with the interference-aided spectrum-fitting method.
To study the influences of the thickness and refractive index of the interference layer, the relationships between the peak shift, interference amplitude (the difference of transmittance between the interference peak and valley), and the refractive index of the interference layer were simulated, as shown in Fig. 2(a). The thicknesses of undetermined films were set as 5.0 nm in this simulation. The interference peak shift that results from the undetermined film is reduced from 3.1% to 0.9% with the increase of the refractive index difference between the substrate and interference layer from 0.08 to 0.98 when the interference layer thickness is 200.0 nm, as Fig. 2(a) shows. This decrease will reduce the determination accuracy of the thickness. However, the interference amplitude will increase with the increase of the refractive index difference, which is helpful for improving the determination accuracy. Therefore, appropriate refractive index of interference layer should be selected to balance the peak shift and interference amplitude. Although the refractive index difference can change freely in theory, the candidate materials in the experiment are limited. , , , , and are some common weakly absorbing materials that can be used as the interference layer. , , and are easily obtained high refractive index materials.
Figure 2.(a) Simulated peak shift and amplitude caused by undetermined film vs. refractive index difference between interference layer and substrate, and (b) simulated peak shift and peak position versus thickness of interference layer. The refractive indexes and thicknesses of the substrate and undetermined film were set as 1.52 and 1.70, 1.0 and 5.0 nm in this simulation, respectively.
The relationships of the peak shift and peak position with the thickness of the interference layer were also studied, as Fig. 2(b) shows, under the condition that the refractive index of interference layer is 2.10. There is no interference peak in the visible band when the interference layer is thinner than 90 nm. With the increase of the interference layer thickness from 90 to 200 nm, the interference peak position increased from 378 to 840 nm. In the meantime, the interference peak position shift caused by the undetermined film decreased from 3.0% to 1.4%. Furthermore, the detector’s sensitivity to the spectrometer and the appropriate interference peak position should be taken into account. A CCD or CMOS detector usually responds at the wave band from 400 to 1100 nm, and the peak response is between 600 and 800 nm[15]. Consequently, an interference layer thickness of about 140 nm is better for determining whose interference peak position is at the wavelength at about 600 nm.
To study the method more practically, experimental-level random noises were considered in both the traditional method and interference-aided spectrum-fitting method. The signal-to-noise ratio (SNR) of the spectrum was set to in the experimental level. Meanwhile, the thickness of the interference layer was set as 140 nm in this simulation. The results of the thickness determination of the ultra-thin films are shown in Table 1.
| dU/nm | dU/nm |
|---|
| nU=2.10 | nU=1.70 | nU=1.52 |
|---|
| Traditional method (error) | Our method (error) | Traditional method (error) | Our method (error) | Traditional method (error) | Our method (error) |
|---|
| 15.0 | 14.9(−1%) | 15.0(0%) | 14.8(−1%) | 15.0(0%) | 59.3(293%) | 15.0(0%) |
| 10.0 | 11.1(11%) | 10.0(0%) | 15.1(51%) | 10.0(0%) | 59.0(490%) | 10.0(0%) |
| 7.0 | 8.7(24%) | 7.0(0%) | 15.2(117%) | 7.0(0%) | 139.4(1891%) | 7.0(0%) |
| 5.0 | 7.1(42%) | 5.0(0%) | 12.7(154%) | 5.0(0%) | 142.2(2744%) | 5.0(0%) |
| 3.0 | 7.3(143%) | 3.0(0%) | 8.9(197%) | 3.0(0%) | 132.2(4307%) | 3.0(0%) |
| 2.0 | 7.5(275%) | 1.9(−5%) | 9.0(350%) | 2.1(5%) | 203.7(10085%) | 1.4(−30%) |
| 1.0 | 7.6(660%) | 1.0(0%) | 9.1(810%) | 1.3(30%) | 254.2(25320%) | 1.5(50%) |
Table 1. Comparison of Simulated Thickness Determination Results Between Traditional and Our Methods with SNR of 1000∶1
The determination limit is defined as the minimum thickness that can be determined with an error less than 20%. For , (thickness of undetermined film) determination using the traditional method is valid over 10.0 nm, where the error is 11%. When the undetermined film is 7.0 nm or thinner, the traditional method is completely invalid. Thus, the determination limit of the traditional method is theoretically about 10.0 nm in this case. But the determination limit of our method can reach 1.0 nm or even thinner when the undetermined film refractive index is 2.10. Similarly, when the undetermined film refractive index decreases to 1.70, the determination limit of our method is 2.0 nm compared to the 15.0 nm limit of the traditional method. Particularly, when the refractive index of the undetermined film is the same as that of substrate, , the ultra-thin film thickness is completely unable to be measured using the traditional method. However, it can still be determined by using the interference-aided spectrum-fitting method, and the determination limit comes to 3.0 nm. Therefore, the determination limit of our method has been greatly improved compared to the traditional method. It is a good way to determine ultra-thin film thicknesses in in-situ operations. The improvement is thanks to the help of the introduced interference layer.
The method is also valid for reflection spectrum fitting in principle. However, since the reflection spectrum is an indirect measurement and will be affected by many factors, such as the incident angle and the reference mirror, its accuracy and reliability are lower than the transmission ones. Therefore, it is used only in cases where the transmission one is invalid or very difficult to be realized, for instance, with opaque substrates or a system where the transmission signal cannot be obtained.
Based on the above theoretical analysis, the interference layer-aided spectrum-fitting method is a prospective way to determinate the thickness of a thin film precisely with a limit less than 1 nm. The determination procedure of the thickness can be conducted as follows: the transmission spectrum of the interference layer-coated substrate is carried out by a spectrometer as a standard reference. The thickness of undetermined film can be obtained by fitting the transmission spectra before and after coating the undetermined film onto the substrate with the interference layer.
To prove the validity of our method, a batch of and interference layers were deposited by the Leybold ARES1110 High Vacuum Coating System as standard pieces. The process is similar to Ref. [15]. with different thickness, as undetermined films, were deposited on the and Si (0 0 1) substrates simultaneously to form steps of that can be measured by atomic force microscope (AFM) as a comparison.
The transmission spectra of samples in the visible and NIR bands were measured by the Lambda 950 spectrometer of PerkinElmer. The thickness of was measured by DI multimode scanning probe microscopy with an IV controller.
The Cauchy model with exponential absorption is useful for dielectric materials far from the absorption bands[16]. The formulas are
The spectra of the and films on these samples were fitted using this material model to describe their optical constants. By fitting the spectrum of each sample, the thickness and refractive index of undetermined film will be carried out directly. The measured (taken by the Lambda 950) and the fitted transmission spectra of the interference layer of deposited on K9 glass are presented in Fig. 3(a). The thickness of is 148.9 nm. Its refractive index is about 2.28 at a wavelength of 600 nm. The spectra of samples with different thicknesses of undetermined films were all fitted perfectly, as Figs. 3(b)–3(f) show. The undetermined film thicknesses were 3.1, 5.6, 7.8, 11.1, and 16.5 nm by fitting, respectively. These results agree very well with the AFM results of 3.5, 5.4, 7.3, 11.8, and 15.8 nm, as shown in the insets of Figs. 3(b)–3(f). Thus, the thicknesses of the undetermined films can be determined by the interference-aided spectrum-fitting method rapidly and accurately, even for only 3.5 nm. The introduction of the interference layer overcomes the shortcomings of traditional fitting methods through transmission or reflection spectra.
Figure 3.(a) Measured (taken by Lambda 950) and fitted transmission spectra of interference layer deposited on K9 glass; measured (taken by Lambda 950), fitted transmission spectra and AFM results of (b) 3.5, (c) 5.4, (d) 7.3, (e) 11.8, and (f) 15.8 nm ultra-thin films on interference layer.
The interference-aided spectrum-fitting method can determine the thickness precisely especially for ultra-thin films, but it needs a high-precision spectrometer to ensure the measured results because it is still strongly dependent on the intensity value. It is useful in ex-situ detection through high-precision spectrometer. But it is expensive and most of online spectroscopy systems do not have such high precision. In order to extend this method for in-situ operations, the requirement for the precision of spectrometer should be reduced.
The above studies show that the peak shifts are different when the refractive indexes of the interference layers are different, as shown in Figs. 4(a) and 4(b). Thus, more information can be obtained if one is using two different interference layers simultaneously. In this case, there are only two unknown quantities, and , with two independent spectra, as shown in Fig. 4(a). They can carry out two independent equations, and and can be solved for separately in principle. When fitted with the actual spectra generated by two different kinds of interference layers simultaneously, the information quantity can be further increased, and the requirement for the spectrometer should be able to be reduced to a certain extent.
Figure 4.(a) Transmission spectra of interference layers and 2.1 and structure diagram of double interference-aided spectra fitting method, and (b) peak shift vs. thickness of undetermined films on interference layers and 2.1.
A double interference-aided spectrum-fitting method has been introduced based on the above mechanism analysis. It can be conducted similar to that of the single interference-aided spectrum-fitting method. The only difference is that two substrates with different interference layers should be put into the coating system to deposit the same ultra-thin film simultaneously. The transmission spectra (or reflection spectra) of these samples can be carried out by a spectrometer in turn. Then, the spectra are fitted simultaneously to get the thickness of the undetermined film.
To validate this approach, and were chosen as the two interference layers. Then, they were put into the coating system together to deposit the undetermined film simultaneously. A high-precision spectrometer, a Lambda 950, and a low-precision fiber micro spectrometer from IdeaOpticals PG 2000 are compared in this work. Table 2 presents the results of thickness determination by different methods. When fitted with spectra measured by the low-precision PG 2000, it is unable to determine the film thickness, even for 15.8 nm with an error larger than 20%. When using the double interference-aided method with the PG 2000, it can give a reasonable result of 15.5 nm, which is thanks to the help of another interference layer. It is similar for other thicknesses, even for 3.5 nm, which can give the result of 3.2 nm. Therefore, the determination limit of the double interference-aided method can also reach 3.5 nm with a low-precision measuring system. Therefore, the double interference-aided method can effectively lower the requirement for the measuring instrument and greatly reduce the cost. The low precision fiber micro spectrometer is often used for in-situ detection. Therefore, the double interference-aided spectrum-fitting method is promising for low-cost online monitoring.
| Method | Thickness of SiO2/nm |
|---|
| AFM | 3.5 | 5.4 | 7.3 | 11.8 | 12.9 | 15.8 |
| Lambda 950 with interference-aided method | 3.1 | 5.6 | 7.8 | 11.1 | 13.5 | 16.5 |
| Fiber spectrometer with interference-aided method | 1.3 | 1.4 | 3.1 | 5.8 | 10.1 | 12.2 |
| Lambda 950 with double interference-aided method | 3.4 | 5.5 | 7.6 | 11.3 | 13.1 | 15.9 |
| Fiber spectrometer with double interference-aided method | 3.2 | 5.1 | 6.8 | 10.9 | 13.6 | 15.5 |
Table 2. Results of Ultra-thin Film Thickness Experimentally Determined with Different Methods
For practical applications of the method, the substrate with the interference layer can be mass produced and easily used as a standard reference just like a quartz monitor crystal. One just needs to measure the spectra before and after depositing the undetermined film and fit them.
Based on the improvement from the interference-aided spectrum-fitting method to the double interference-aided spectra fitting method, three or more different interference layers may be used to meet different measuring demands. Furthermore, a determination chip that integrates multi-interference layers should be helpful in thickness determination for any unknown films, which can provide more information for analysis.
In conclusion, an interference-aided spectrum-fitting method is proposed to determine the film thickness precisely. An interference layer is introduced to form an interference peak in the transmission (or reflection) spectrum. It can result in an obvious interference peak shift and enlarge the intensity change of the spectrum several times, which is helpful to improve the thickness determination precision and the limit of the thin film. The determination limit can theoretically reach less than 1 nm. It is verified by the experiments, and the determination limit is at least 3.5 nm. Furthermore, the double interference-aided fitting method is developed to lower the requirement for the measuring system and to reduce the cost. It provides a prospective way for very high-precision on-site and in-situ thickness determination, especially for ultra-thin films.
References
[1] F. Schwierz. Nat. Nanotechnol., 5, 487(2010).
[2] E. Ando, M. Miyazaki. Thin Solid Films, 351, 308(1999).
[3] C. Chen, H. Qiao, Y. Xue, W. Yu, J. Song, Y. Lu, S. Li, Q. Bao. Photon. Res., 3, 110(2015).
[4] J. Hu, Q. Li, X. Lin, Y. Liu, J. Long, L. Wang, H. Tang. Chin. Opt. Lett., 12, 072201(2014).
[5] C. S. Lu, O. Lewis. J. Appl. Phys., 43, 4385(1972).
[6] J. D. Klein, A. Yen, S. F. Cogan. J. Appl. Phys., 68, 1825(1990).
[7] J. Kucirek. Czech. J. Phys. B, 19, 537(1969).
[8] C. Qiu, X. Sun, M. Luan. Chin. Opt. Lett., 11, 071201(2013).
[9] E. A. Irene. Solid-State Electron., 45, 1207(2001).
[10] S. Wilbrandt, O. Stenzel, N. Kaiser, M. K. Trubetskov, A. V. Tikhonravov. Appl. Opt., 47, C49(2008).
[11] Z. Y. Li, L. L. Lin. Phys. Rev. E, 67, 046607(2003).
[12] T. Gungor, B. SaKa. Thin Solid Films, 467, 319(2004).
[13] Z. X. Yu, D. Mo. Thin Solid Films, 425, 108(2003).
[14] S. Bosch, J. F. Borrull, J. S. Parramon. Solid-State Electron., 45, 703(2001).
[15] S. W. Wang, F. L. Chen, L. Y. Liang, S. L. He, Y. G. Wang, X. S. Chen, W. Lu. IEEE Wireless Commun., 22, 61(2015).
[16] S. Nevas, F. Manoocheri, E. Ikonen. Metrologia, 40, S200(2003).