• High Power Laser and Particle Beams
  • Vol. 34, Issue 3, 031010 (2022)
Yanlong Xu1, Wenge Li1、*, Zhonghan Yu1, Yuantao Zhao1, Feng Gao1, and Xilian Xie2
Author Affiliations
  • 1Merchant Marine College Shanghai Maritime University, Shanghai 201306, China
  • 2Nanjing Kangni Electromechanical Co., Ltd., Nanjing 210023, China
  • show less
    DOI: 10.11884/HPLPB202234.210283 Cite this Article
    Yanlong Xu, Wenge Li, Zhonghan Yu, Yuantao Zhao, Feng Gao, Xilian Xie. Research on bonding test of 5052 aluminum alloy based on laser texturing technology[J]. High Power Laser and Particle Beams, 2022, 34(3): 031010 Copy Citation Text show less
    Schematic diagram of laser texturing
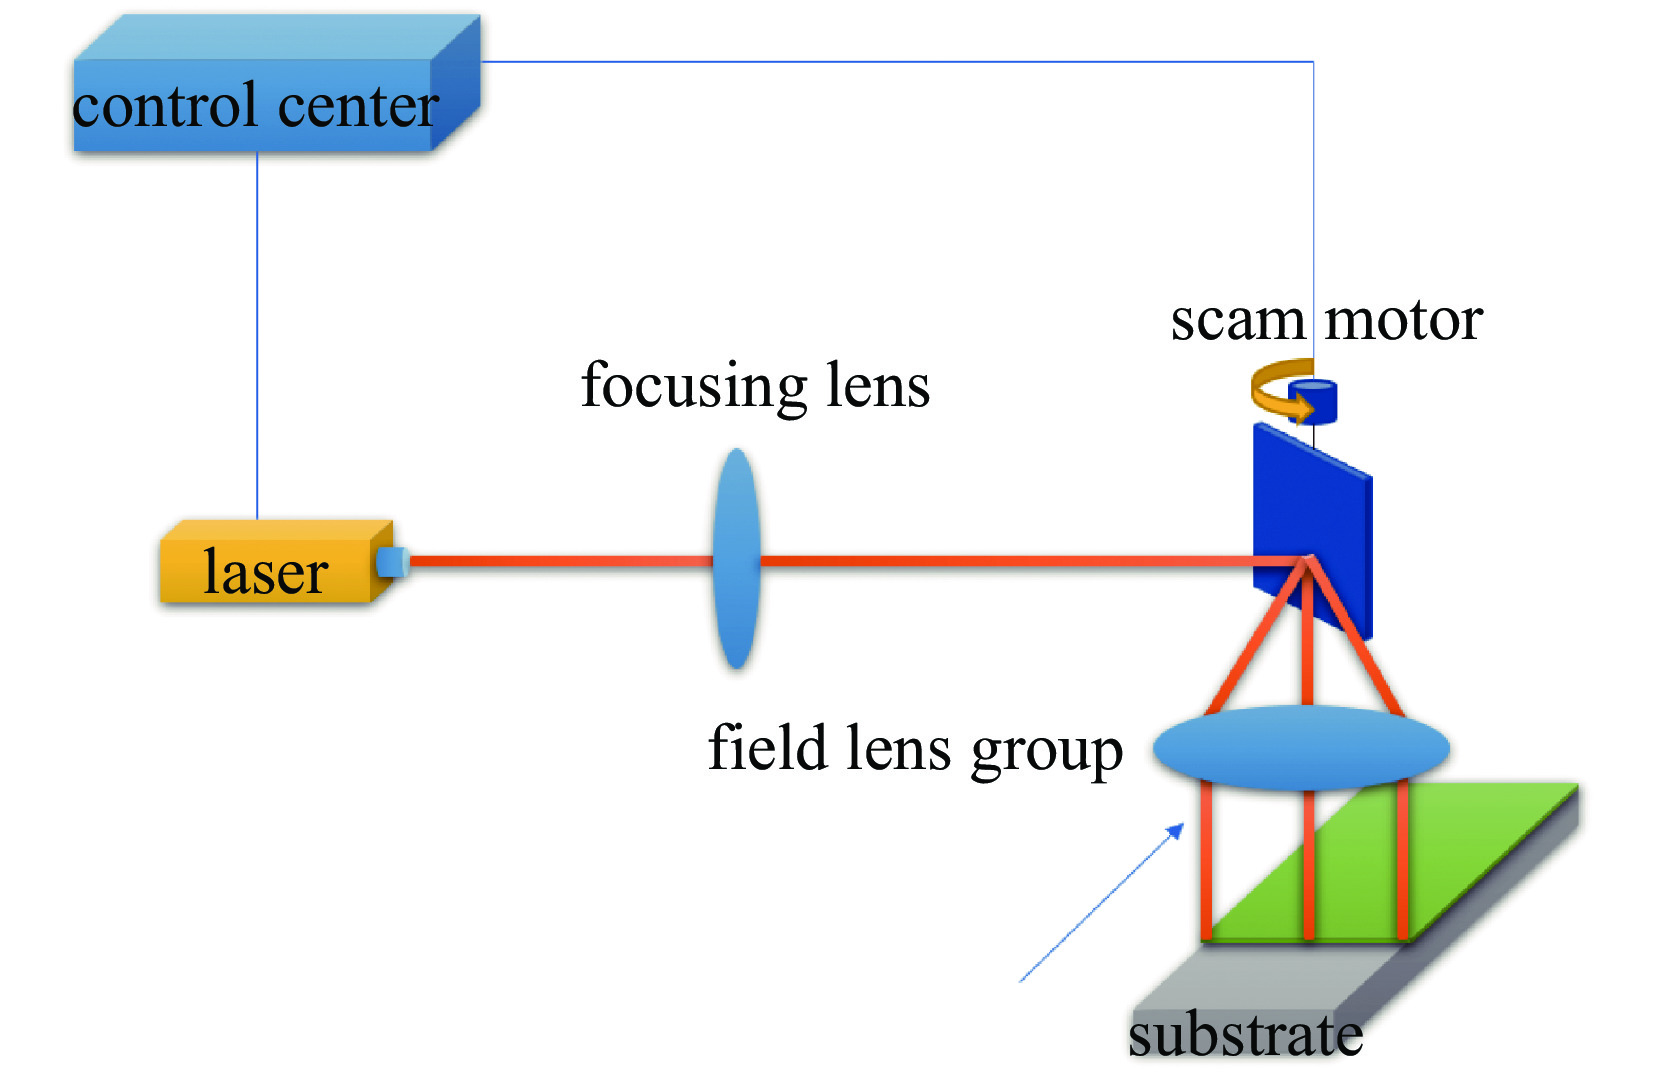
    Fig. 1. Schematic diagram of laser texturing
    Laser texturing test platform
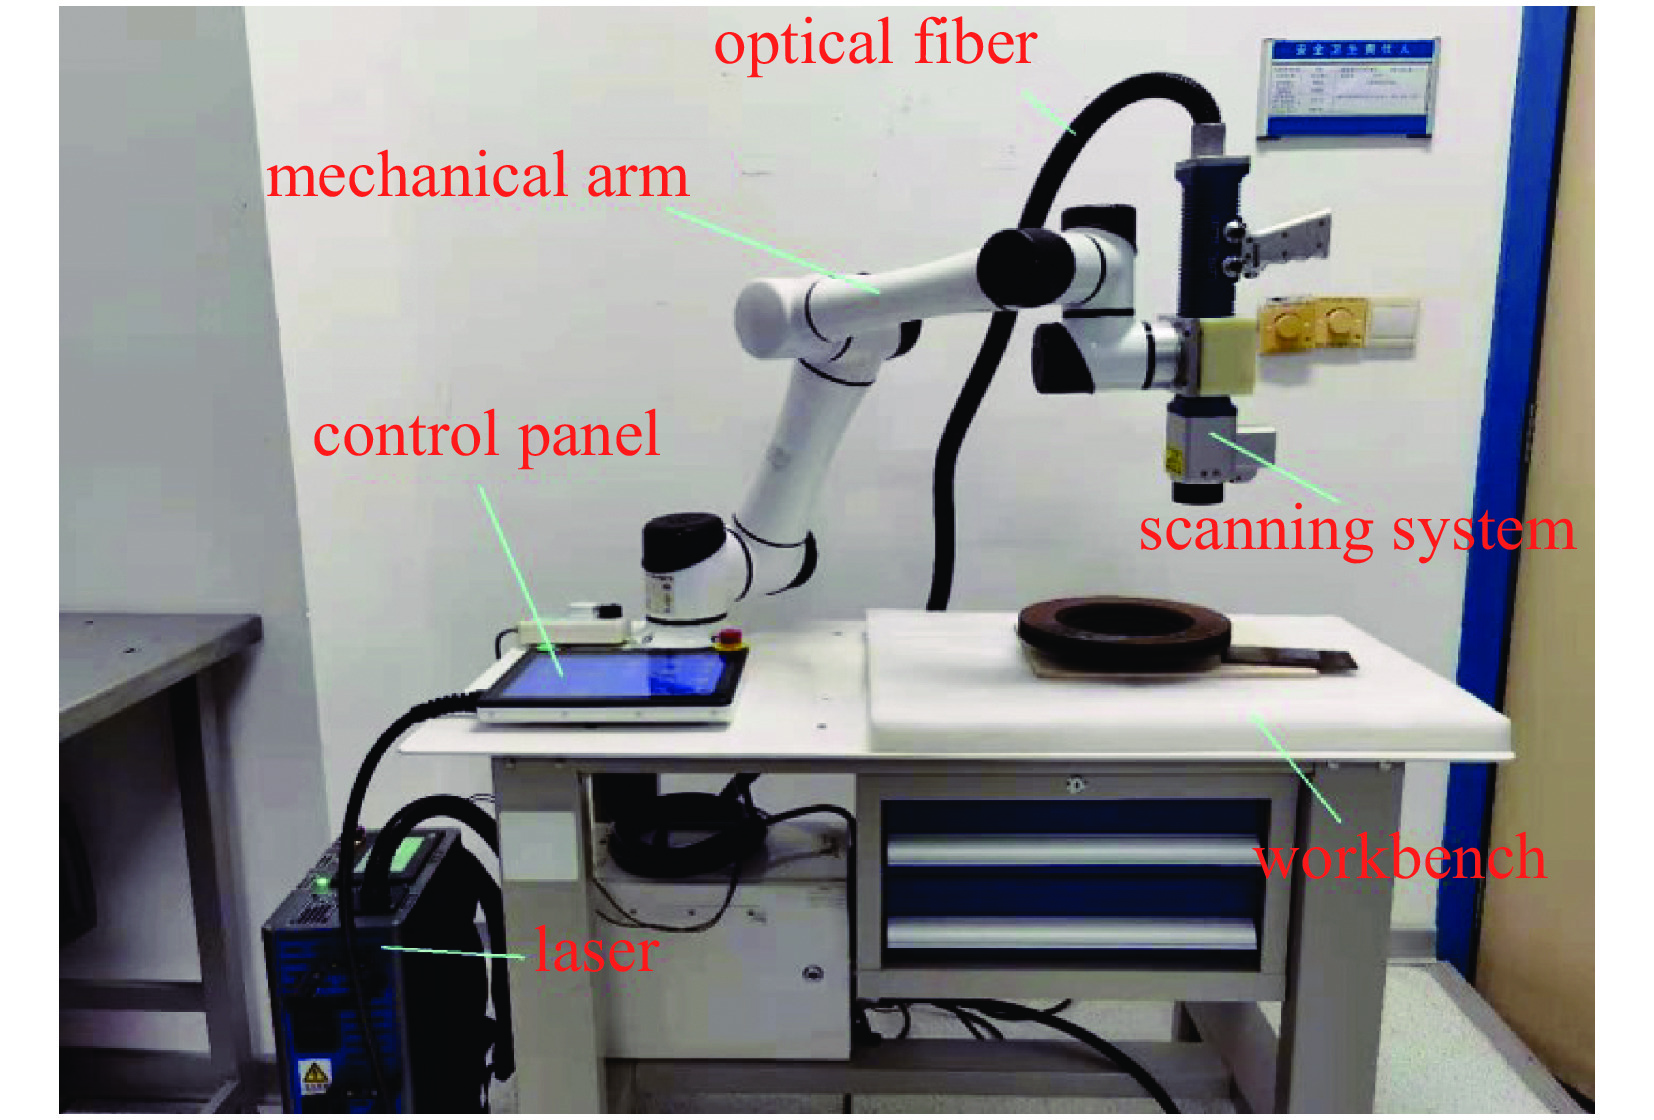
    Fig. 2. Laser texturing test platform
    Topography observed by metallurgical microscope
    Fig. 3. Topography observed by metallurgical microscope
    Micro-topography images observed by SEM
    Fig. 4. Micro-topography images observed by SEM
    Size of specimen
    Fig. 5. Size of specimen
    Comparison diagram of surface roughness and tensile shear strength
    Fig. 6. Comparison diagram of surface roughness and tensile shear strength
    levelpower/Wscan speed/(mm·s−1) frequency/kHzpulse width/ns
    13010500100
    260201000200
    390301500300
    Table 1. Factor level table
    numberpower/Wscan speed/(mm·s−1) frequency/kHzpulse width /nssurface roughness/μm
    130105001000.661
    2302010002000.383
    3303015003000.413
    4601010003001.540
    5602015001000.394
    660305002000.836
    7901015002002.270
    890205003001.221
    9903010001001.810
    Table 2. Orthogonal experimental design and results
    projectsurface roughness/μm
    power Ascan speed BfrequencyCpulse widthD
    K10.4861.4900.9060.955
    K20.9230.6661.2441.163
    K31.7671.0201.0261.058
    range1.2830.8240.3380.208
    Table 3. Range analysis
    samplessurface roughness/μm
    no treatment0.38
    80# sandpaper polishing3.2
    optimal parameter laser texturing2.35
    Table 4. Roughness value of three types
    density /(g·cm−3) elastic modulus /GPaPoisson’s ratioyield strength/MPa
    2.68690.3265
    Table 5. Mechanical properties of 5052 aluminum alloy
    componentcuring temperature/℃density/(kg·m−3) curing time/minPoisson’s ratio
    J-69F1 epoxy resin1301200750.12
    Table 6. Material parameters of adhesive
    samplesnumberfailure load/Ntensile shear strength/MPaaverage tensile shear strength/MPa
    no treatment16033.8914.714.12
    25805.8414.3
    35869.3714.2
    45785.7713.8
    55937.8113.6
    80# sandpaper polishing17269.7821.7720.88
    25922.8919.42
    36877.2521.16
    47333.9222.04
    56237.2320.03
    optimal parameter laser texturing 18726.9424.3924.72
    28108.4224.94
    38242.0425.17
    47625.5723.46
    58363.4325.62
    Table 7. Tensile shear test
    Yanlong Xu, Wenge Li, Zhonghan Yu, Yuantao Zhao, Feng Gao, Xilian Xie. Research on bonding test of 5052 aluminum alloy based on laser texturing technology[J]. High Power Laser and Particle Beams, 2022, 34(3): 031010
    Download Citation