• Photonics Research
  • Vol. 8, Issue 7, 1100 (2020)
Chang Kyun Ha1, Ki Sang Lee1, Dohyeon Kwon2, and Myeong Soo Kang1、*
Author Affiliations
  • 1Department of Physics, Korea Advanced Institute of Science and Technology (KAIST), Daejeon 34141, South Korea
  • 2School of Mechanical and Aerospace Engineering, Korea Advanced Institute of Science and Technology (KAIST), Daejeon 34141, South Korea
  • show less
    DOI: 10.1364/PRJ.389080 Cite this Article Set citation alerts
    Chang Kyun Ha, Ki Sang Lee, Dohyeon Kwon, Myeong Soo Kang. Widely tunable ultra-narrow-linewidth dissipative soliton generation at the telecom band[J]. Photonics Research, 2020, 8(7): 1100 Copy Citation Text show less
    Schematic diagram of the widely tunable ultra-narrow-linewidth passively mode-locked erbium fiber laser. LD, laser diode; WDM, wavelength division multiplexer; EDF, erbium-doped fiber; TBF, tunable bandpass filter; SESAM, semiconductor saturable absorber mirror; PC, polarization controller.
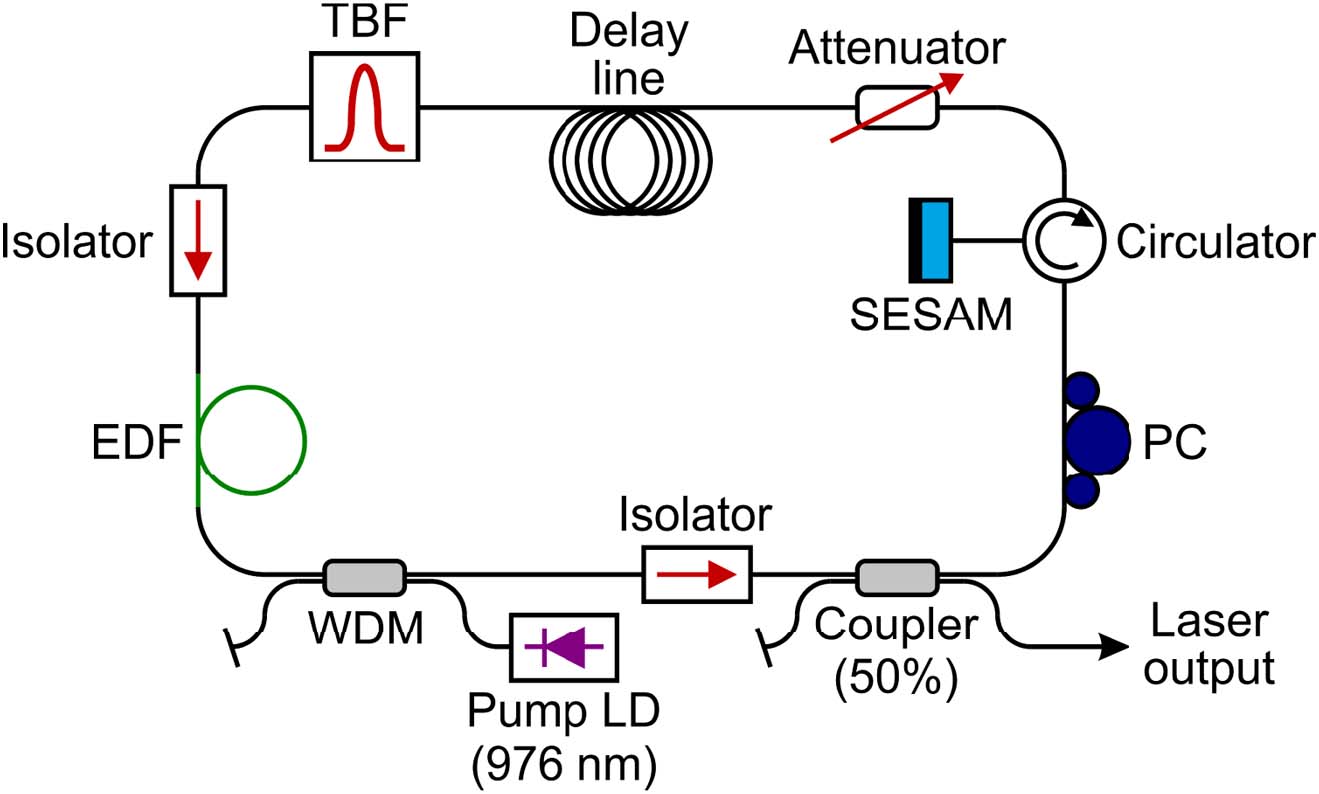
    Fig. 1. Schematic diagram of the widely tunable ultra-narrow-linewidth passively mode-locked erbium fiber laser. LD, laser diode; WDM, wavelength division multiplexer; EDF, erbium-doped fiber; TBF, tunable bandpass filter; SESAM, semiconductor saturable absorber mirror; PC, polarization controller.
    Characterization of the laser output. (a) Oscilloscope trace, (b) intensity autocorrelation. Note that the width of the autocorrelation trace is larger than the actual pulse width by a factor of 1.54 for sech2-shaped pulses. Although the autocorrelation trace is slightly asymmetric due to a minor imperfection in our intensity autocorrelator that appears around the +200 ps bound of the scan range, such asymmetry does not hinder the reliable determination of the pulse width. (c) Electrical spectrum over a narrower frequency span (40 MHz), (d) electrical spectrum over a wider frequency span (6 GHz), (e) optical spectrum measured with a grating-based optical spectrum analyzer with a resolution bandwidth of 0.05 nm, (f) high-resolution optical spectrum obtained from the electrical spectrum of the beat note (peaking at 17.5 GHz in this case) that is formed by a continuous-wave local oscillator and the laser output. In (a)–(f), the pump power is fixed at 265.2 mW. (g)–(j) Pump power dependence of the laser output parameters: (g) pulse width, (h) linewidth, (i) time–bandwidth product (TBP), (j) pulse energy. The pulse width is determined from the intensity autocorrelation signal in (b), assuming a sech2 pulse shape. The linewidth is determined from the electrical spectrum of the beat note in (f). Each error bar represents the standard deviation of 20 repeated measurements. The laser center wavelength is fixed at 1550 nm for all measurements.
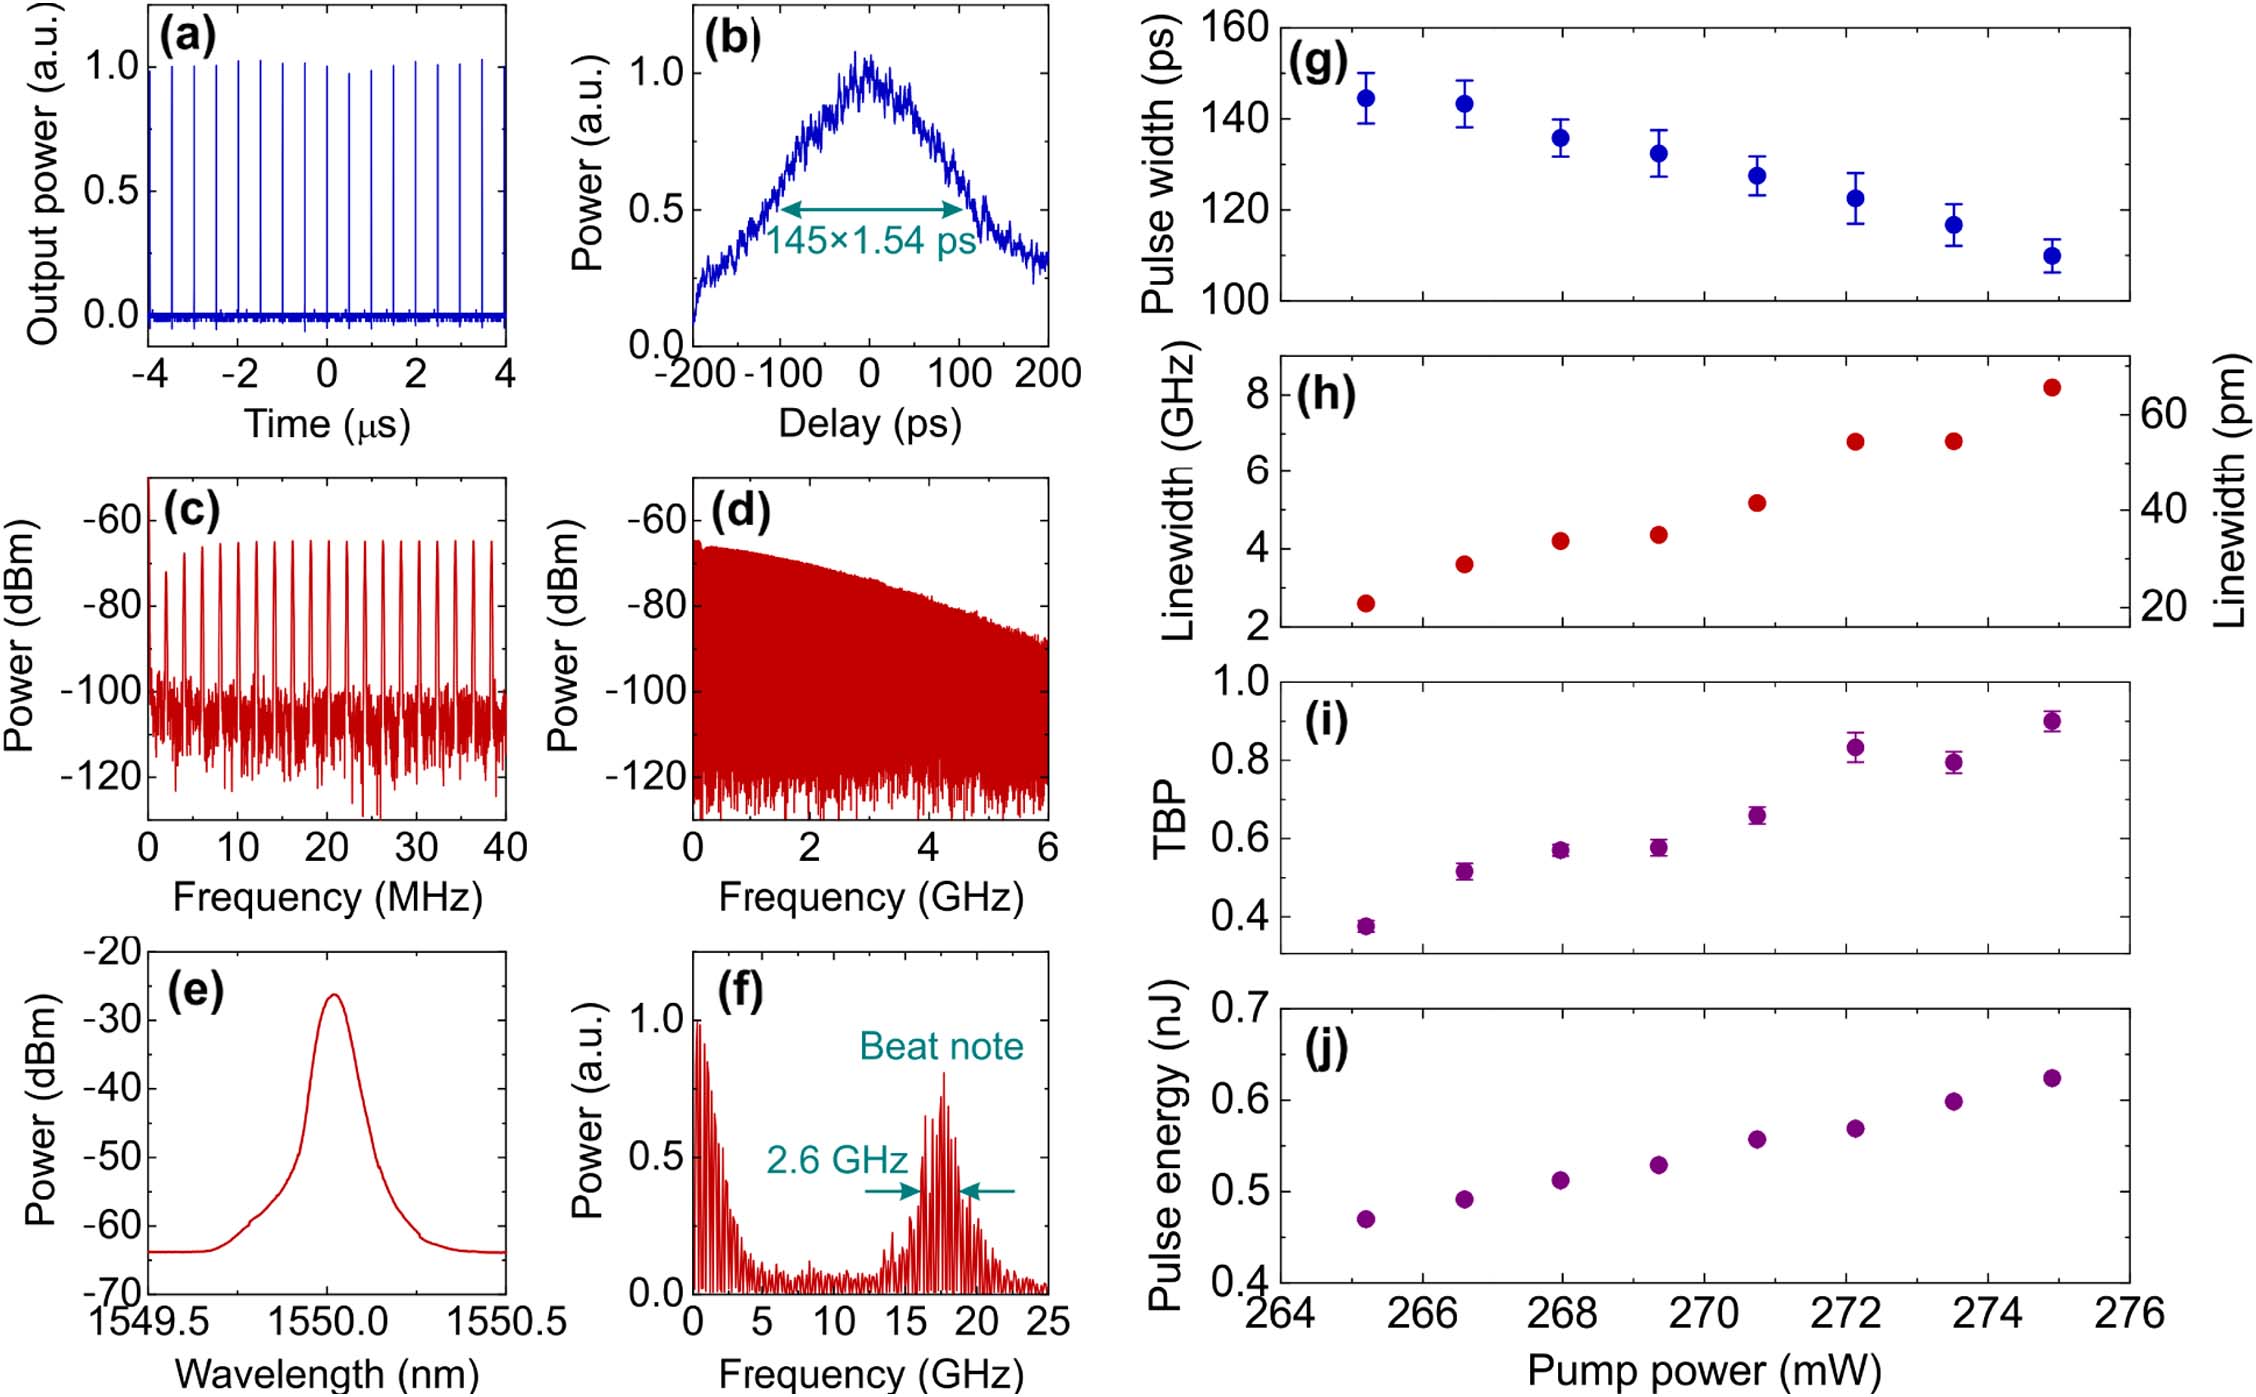
    Fig. 2. Characterization of the laser output. (a) Oscilloscope trace, (b) intensity autocorrelation. Note that the width of the autocorrelation trace is larger than the actual pulse width by a factor of 1.54 for sech2-shaped pulses. Although the autocorrelation trace is slightly asymmetric due to a minor imperfection in our intensity autocorrelator that appears around the +200  ps bound of the scan range, such asymmetry does not hinder the reliable determination of the pulse width. (c) Electrical spectrum over a narrower frequency span (40 MHz), (d) electrical spectrum over a wider frequency span (6 GHz), (e) optical spectrum measured with a grating-based optical spectrum analyzer with a resolution bandwidth of 0.05 nm, (f) high-resolution optical spectrum obtained from the electrical spectrum of the beat note (peaking at 17.5 GHz in this case) that is formed by a continuous-wave local oscillator and the laser output. In (a)–(f), the pump power is fixed at 265.2 mW. (g)–(j) Pump power dependence of the laser output parameters: (g) pulse width, (h) linewidth, (i) time–bandwidth product (TBP), (j) pulse energy. The pulse width is determined from the intensity autocorrelation signal in (b), assuming a sech2 pulse shape. The linewidth is determined from the electrical spectrum of the beat note in (f). Each error bar represents the standard deviation of 20 repeated measurements. The laser center wavelength is fixed at 1550 nm for all measurements.
    Numerical modeling of mode-locked laser pulses. (a) Temporal pulse profiles and (b) pulse spectra at three different small-signal gain coefficients (11.7 dB for red, 12.5 dB for green, and 13.2 dB for blue); (c)–(f) calculated pulse parameters, (c) pulse width, (d) linewidth, (e) time–bandwidth product (TBP), and (f) pulse energy over a range of small-signal gain coefficient values. The three vertical arrows in (c) indicate the small-signal gain coefficients that correspond to the curves of respective colors in (a) and (b). The laser wavelength is fixed at 1550 nm for all calculations.
    Fig. 3. Numerical modeling of mode-locked laser pulses. (a) Temporal pulse profiles and (b) pulse spectra at three different small-signal gain coefficients (11.7 dB for red, 12.5 dB for green, and 13.2 dB for blue); (c)–(f) calculated pulse parameters, (c) pulse width, (d) linewidth, (e) time–bandwidth product (TBP), and (f) pulse energy over a range of small-signal gain coefficient values. The three vertical arrows in (c) indicate the small-signal gain coefficients that correspond to the curves of respective colors in (a) and (b). The laser wavelength is fixed at 1550 nm for all calculations.
    Theoretical analysis of our ultra-narrow-linewidth dissipative soliton fiber laser. (a)–(d) Intracavity evolution of the pulse parameters: (a) pulse width, (b) linewidth, (c) time–bandwidth product (TBP), (d) pulse energy. F, bandpass filter; EDF, erbium-doped fiber; O, 50/50 output coupler; S, saturable absorber; A, attenuator. (e) Calculated pulse widths over a varying SESAM modulation depth for five different intracavity filter bandwidths (0.09, 0.11, 0.13, 0.17, and 0.23 nm). The gray region indicates where the stationary single-pulse solution does not exist. The small-signal gain coefficient is fixed at g0=12.5 dB for all the calculations.
    Fig. 4. Theoretical analysis of our ultra-narrow-linewidth dissipative soliton fiber laser. (a)–(d) Intracavity evolution of the pulse parameters: (a) pulse width, (b) linewidth, (c) time–bandwidth product (TBP), (d) pulse energy. F, bandpass filter; EDF, erbium-doped fiber; O, 50/50 output coupler; S, saturable absorber; A, attenuator. (e) Calculated pulse widths over a varying SESAM modulation depth for five different intracavity filter bandwidths (0.09, 0.11, 0.13, 0.17, and 0.23 nm). The gray region indicates where the stationary single-pulse solution does not exist. The small-signal gain coefficient is fixed at g0=12.5  dB for all the calculations.
    Dependence of pulse parameters on the delay line length measured over a range of pump power values. (a)–(d) Measured pulse parameters, (a) pulse width, (b) linewidth, (c) time–bandwidth product (TBP), and (d) pulse energy for six different lengths of standard single-mode fiber (SMF) delay line (40, 50, 60, 70, 80, and 140 m), which yield net cavity dispersions of 1.1, 1.3, 1.5, 1.7, 1.8, and 2.8 ps/nm, respectively. (e)–(h) Measured pulse parameters, (e) pulse width, (f) linewidth, (g) TBP, and (h) pulse energy for six different lengths of non-zero dispersion-shifted fiber (NZDSF) delay line (40, 50, 60, 70, 80, and 140 m), which yield net cavity dispersions of 0.16, 0.11, 0.065, 0.013, −0.0079, and −0.24 ps/nm, respectively. The colored numbers in (a) and (e) indicate the net cavity dispersions in ps/nm. The laser wavelength is fixed at 1550 nm for all measurements.
    Fig. 5. Dependence of pulse parameters on the delay line length measured over a range of pump power values. (a)–(d) Measured pulse parameters, (a) pulse width, (b) linewidth, (c) time–bandwidth product (TBP), and (d) pulse energy for six different lengths of standard single-mode fiber (SMF) delay line (40, 50, 60, 70, 80, and 140 m), which yield net cavity dispersions of 1.1, 1.3, 1.5, 1.7, 1.8, and 2.8 ps/nm, respectively. (e)–(h) Measured pulse parameters, (e) pulse width, (f) linewidth, (g) TBP, and (h) pulse energy for six different lengths of non-zero dispersion-shifted fiber (NZDSF) delay line (40, 50, 60, 70, 80, and 140 m), which yield net cavity dispersions of 0.16, 0.11, 0.065, 0.013, 0.0079, and 0.24  ps/nm, respectively. The colored numbers in (a) and (e) indicate the net cavity dispersions in ps/nm. The laser wavelength is fixed at 1550 nm for all measurements.
    Characteristics of laser wavelength tuning. (a) Normalized optical output spectra of the laser with an 80-m-long single-mode fiber (SMF) delay line obtained by a grating-based optical spectrum analyzer (OSA). The laser wavelength can be tuned without pulse breakup over a 34.3 nm range (1529.3–1563.6 nm) by changing the center wavelength of the intracavity tunable bandpass filter and the pump power. (b)–(e) Pump power dependence of pulse parameters, (b) pulse width, (c) linewidth, (d) time–bandwidth product (TBP), and (e) pulse energy measured at six different laser wavelengths. (f) Normalized optical output spectra of the laser with an 80-m-long non-zero dispersion-shifted fiber (NZDSF) delay line obtained by a grating-based OSA. The laser wavelength can be tuned without pulse breakup over a 33.4 nm range (1529.7–1563.1 nm). (g)–(j) Pump power dependence of pulse parameters, (g) pulse width, (h) linewidth, (i) TBP, and (j) pulse energy measured at six different laser wavelengths. The colored numbers in (b) and (g) indicate the laser wavelengths in nm, which correspond to the colors of the laser spectra in (a) and (e), respectively. The laser spectra in black in (a) and (f) are obtained close to the lower and upper bounds of the wavelength tuning range.
    Fig. 6. Characteristics of laser wavelength tuning. (a) Normalized optical output spectra of the laser with an 80-m-long single-mode fiber (SMF) delay line obtained by a grating-based optical spectrum analyzer (OSA). The laser wavelength can be tuned without pulse breakup over a 34.3 nm range (1529.3–1563.6 nm) by changing the center wavelength of the intracavity tunable bandpass filter and the pump power. (b)–(e) Pump power dependence of pulse parameters, (b) pulse width, (c) linewidth, (d) time–bandwidth product (TBP), and (e) pulse energy measured at six different laser wavelengths. (f) Normalized optical output spectra of the laser with an 80-m-long non-zero dispersion-shifted fiber (NZDSF) delay line obtained by a grating-based OSA. The laser wavelength can be tuned without pulse breakup over a 33.4 nm range (1529.7–1563.1 nm). (g)–(j) Pump power dependence of pulse parameters, (g) pulse width, (h) linewidth, (i) TBP, and (j) pulse energy measured at six different laser wavelengths. The colored numbers in (b) and (g) indicate the laser wavelengths in nm, which correspond to the colors of the laser spectra in (a) and (e), respectively. The laser spectra in black in (a) and (f) are obtained close to the lower and upper bounds of the wavelength tuning range.
    Characteristics of the laser noise. (a) Timing jitter power spectrum, (b) integrated timing jitter, (c) relative intensity noise (RIN) power spectrum, (d) integrated RIN. In all measurements, we fix the pump power as 265.2 mW, the single-mode fiber delay line length as 80 m, and the laser wavelength as 1550 nm. PSD, power spectral density.
    Fig. 7. Characteristics of the laser noise. (a) Timing jitter power spectrum, (b) integrated timing jitter, (c) relative intensity noise (RIN) power spectrum, (d) integrated RIN. In all measurements, we fix the pump power as 265.2 mW, the single-mode fiber delay line length as 80 m, and the laser wavelength as 1550 nm. PSD, power spectral density.
    Chang Kyun Ha, Ki Sang Lee, Dohyeon Kwon, Myeong Soo Kang. Widely tunable ultra-narrow-linewidth dissipative soliton generation at the telecom band[J]. Photonics Research, 2020, 8(7): 1100
    Download Citation