Author Affiliations
School of Electronics and Information Engineering, Xi'an Technological University, Xi'an, Shaanxi 710021, Chinashow less
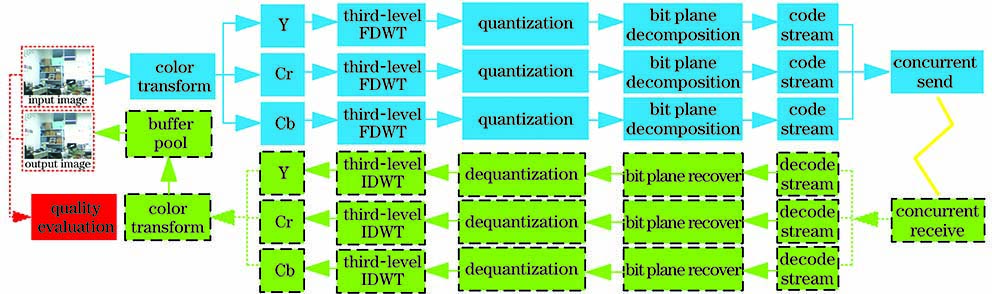
Fig. 1. Overall implementation diagram of system
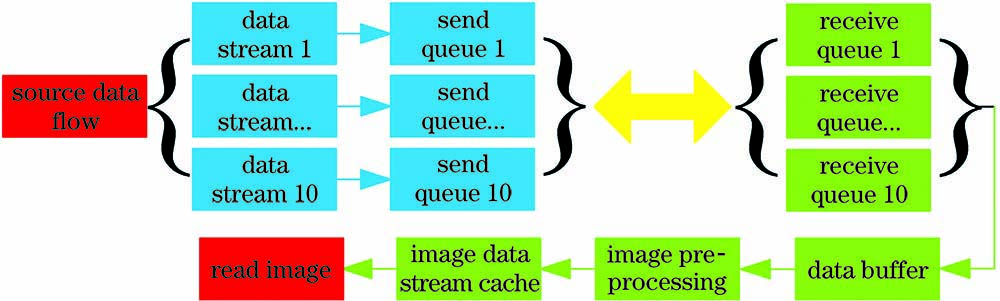
Fig. 2. Image transmission model
Fig. 3. Flowchart of encoding and decoding
Fig. 4. Wavelet decomposition detail diagram. (a) Detailed information; (b) horizontal detail; (c) vertical detail; (d) diagonal detail
Fig. 5. Diagram of third-order wavelet transform
Fig. 6. Flowchart of three-level wavelet decomposition
Fig. 7. Original image
Fig. 8. Output image obtained by three-level wavelet transformation
Fig. 9. Three-component decomposition quantization output images at acquisition end. (a) Y; (b) Cr; (c) Cb
Fig. 10. Three-component restoration output images at receiving end. (a) Y; (b) Cr; (c) Cb
Fig. 11. Images. (a) Collected image; (b) received image
Fig. 12. Trend of receiving time delay
Fig. 13. Trend of receiving frame rate
| Image | | | SSIM | RMSE |
|---|
| FDWT&IDWT | FDWT1 | IDWT1 | 0.986780 | | | FDWT2 | IDWT2 | 0.986678 | | | FDWT3 | IDWT3 | 0.987841 | | | Q&IQ | Q_Y | IQ_Y | 0.987745 | | | Q_Cr | IQ_Cr | 0.989623 | | | Q_Cb | IQ_Cb | 0.980875 | | | Image comparison | Srcimage | Recimage | 0.987928 | 1.633673 |
|
Table 1. Comparison of indicators in transmission process
| | SSIM | RMSE |
|---|
| Srcimage 1 | Recimage 1 | 0.985544 | 1.615866 | | Srcimage 2 | Recimage 2 | 0.985799 | 1.634215 | | Srcimage 3 | Recimage 3 | 0.985878 | 1.587972 | | Srcimage 4 | Recimage 4 | 0.985326 | 1.613286 | | Srcimage 5 | Recimage 5 | 0.984940 | 1.664491 | | Srcimage 6 | Recimage 6 | 0.985986 | 1.572247 | | Srcimage 7 | Recimage 7 | 0.984756 | 1.613159 | | Srcimage 8 | Recimage 8 | 0.975412 | 1.632571 | | Srcimage 9 | Recimage 9 | 0.984568 | 1.571135 | | Srcimage 10 | Recimage 10 | 0.985979 | 1.564518 |
|
Table 2. Quantitative description of 640×480 image quality
| | SSIM | RMSE | | | | SSIM | RMSE |
|---|
| Srcimage 1 | Recimage 1 | 0.977228 | 2.680730 | Srcimage 6 | Recimage 6 | 0.975578 | 2.678446 |
|---|
| Srcimage 2 | Recimage 2 | 0.975794 | 2.689732 | Srcimage 7 | Recimage 7 | 0.974850 | 2.674558 | | Srcimage 3 | Recimage 3 | 0.975895 | 2.687534 | Srcimage 8 | Recimage 8 | 0.978012 | 2.685717 | | Srcimage 4 | Recimage 4 | 0.978647 | 2.683296 | Srcimage 9 | Recimage 9 | 0.984051 | 2.678637 | | Srcimage 5 | Recimage 5 | 0.986541 | 2.667825 | Srcimage 10 | Recimage 10 | 0.981211 | 2.684916 |
|
Table 3. Quantitative description of 1280×720 image quality
| Algorithm | Image resolution | SSIM | RMSE | Total receivingtime/ms | Speed/(frame·s-1) |
|---|
| JPEG(P=80, R=0) | 640×480 | 0.935073 | 4.359058 | 25 | 45 | | 1280×720 | | | | | | JPEG(P=60, R=10) | 640×480 | 0.915425 | 5.187605 | 29 | 43 | | 1280×720 | 0.907840 | 5.147938 | 45 | 38 | | JPEG2000 | 640×480 | 0.963516 | 3.124578 | 30 | 38 | | 1280×720 | 0.954521 | 3.061465 | 47 | 36 | | SVD(S=40, R=10) | 640×480 | 0.937214 | 4.183163 | 24 | 48 | | 1280×720 | 0.934430 | 4.025180 | 46 | 32 | | SVD(S=50, R=10) | 640×480 | 0.955571 | 3.217802 | 35 | 37 | | 1280×720 | 0.954312 | 3.118540 | 48 | 33 | | Proposed algorithm(R=10) | 640×480 | 0.985472 | 1.650121 | 26 | 42 | | 1280×720 | 0.972370 | 2.674558 | 43 | 28 |
|
Table 4. Performance comparison of different algorithms
| Imageresolution | Acquisitiontime/ms | Coding Time/ms | Decodingtime/ms | Displaytime/ms | Total receivingtime/ms | Speed/(frame·s-1) |
|---|
| 640×480 | 8.046150 | 21.657586 | 19.525346 | 0.291347 | 24 | 40 | | 640×480 | 4.781484 | 20.752239 | 19.510056 | 0.461578 | 45 | 36 | | 640×480 | 6.237983 | 20.955538 | 19.324789 | 0.262260 | 37 | 43 | | 640×480 | 9.234905 | 20.955729 | 19.425044 | 0.368356 | 33 | 42 | | 640×480 | 7.363080 | 21.958112 | 19.622812 | 0.220060 | 30 | 55 | | 640×480 | 7.099151 | 21.256327 | 19.625601 | 0.759601 | 27 | 52 | | 640×480 | 7.047653 | 20.955729 | 19.725832 | 0.778436 | 21 | 40 | | 640×480 | 8.022308 | 20.958542 | 19.826087 | 0.518560 | 53 | 59 | | 640×480 | 7.053852 | 20.855641 | 19.725904 | 0.508308 | 50 | 57 | | 640×480 | 6.074666 | 21.256828 | 19.725952 | 0.229358 | 37 | 53 | | 1280×720 | 11.811349 | 43.198490 | 43.415474 | 1.002645 | 45 | 29 | | 1280×720 | 13.190103 | 42.543315 | 43.315148 | 1.002550 | 45 | 30 | | 1280×720 | 12.003826 | 41.543960 | 42.813849 | 1.003265 | 48 | 29 | | 1280×720 | 10.649919 | 41.941475 | 43.205571 | 1.034021 | 46 | 31 | | 1280×720 | 11.999368 | 42.145586 | 43.214893 | 1.002073 | 43 | 30 | | 1280×720 | 11.032342 | 42.546129 | 43.115067 | 1.503229 | 45 | 29 | | 1280×720 | 13.033390 | 42.744135 | 42.716670 | 2.005577 | 60 | 27 | | 1280×720 | 12.539241 | 42.746853 | 42.763590 | 1.006126 | 44 | 29 | | 1280×720 | 12.816667 | 42.021489 | 43.096685 | 1.005411 | 43 | 28 | | 1280×720 | 12.212991 | 43.448495 | 42.987799 | 2.009392 | 40 | 26 |
|
Table 5. Statistical results of each parameter of collected and received images