
Rui CONG, Sheng ZHOU, Gang CHEN, Qing-Yuan CAI, Lin JIANG, Ding-Quan LIU. The effects of reflection phase shift on filtering performance of a tunable Fabry-Perot filter with a small cavity length[J]. Journal of Infrared and Millimeter Waves, 2021, 40(1): 44
- Journal of Infrared and Millimeter Waves
- Vol. 40, Issue 1, 44 (2021)
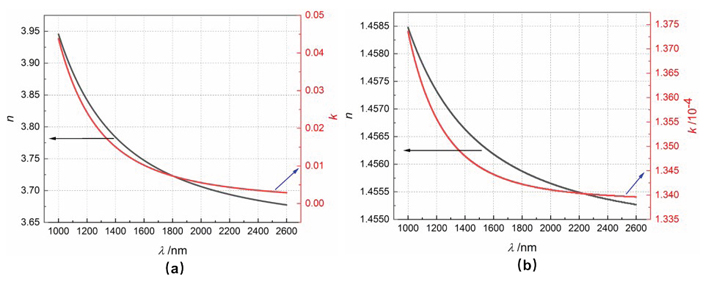
Fig. 1. Dispersion curves of refractive index and extinction coefficient of thin film materials (a) n (λ ) and k (λ ) of Si; (b) n (λ ) and k (λ ) of SiO2
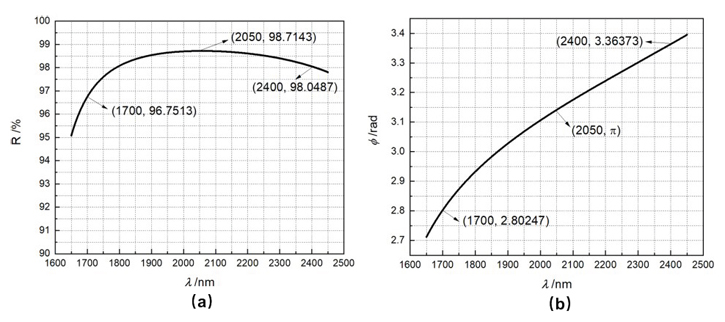
Fig. 2. Reflection characteristics of dielectric mirrors for TFPF (a) The reflectance spectrum, (b) The reflection phase shift dispersion curve
Fig. 3. Transmission spectrum of TFPF with different cavity length before and after reflection phase shift considered (a) d: 850~1 200 nm, ∆d=25 nm,
Fig. 4. The relationship between peak position of passband and cavity length for TFPF (a) d: 850~1 200 nm, ∆d=25 nm; (b) d: 1 700~2 400 nm, ∆d=50 nm
Fig. 5. Comparison of peak transmission for TFPF before and after reflection phase shift considered (a) d: 850~1 200 nm, ∆d=25 nm, (b) d: 17 00~2 400 nm, ∆d=50 nm
Fig. 6. Curves of FWHM versus peak position for TFPF (a) d: 850~1 200 nm, ∆d=25 nm, (b) d: 1 700~2 400 nm, ∆d=50 nm
|
Table 1. Changes of peak position for TFPF resulting from
|
Table 2. Changes of FWHM for TFPF resulting from

Set citation alerts for the article
Please enter your email address
© Copyright 2018-2021 | Chinese Laser Press. All Rights Reserved 沪ICP备15018463号-20