
Lin Wang, Lai Wei, Zheng-Xiong Wang. Effect of out-of-plane driving flow on formation of plasmoids in current sheet system [J]. Acta Physica Sinica, 2020, 69(5): 059401-1
- Acta Physica Sinica
- Vol. 69, Issue 5, 059401-1 (2020)
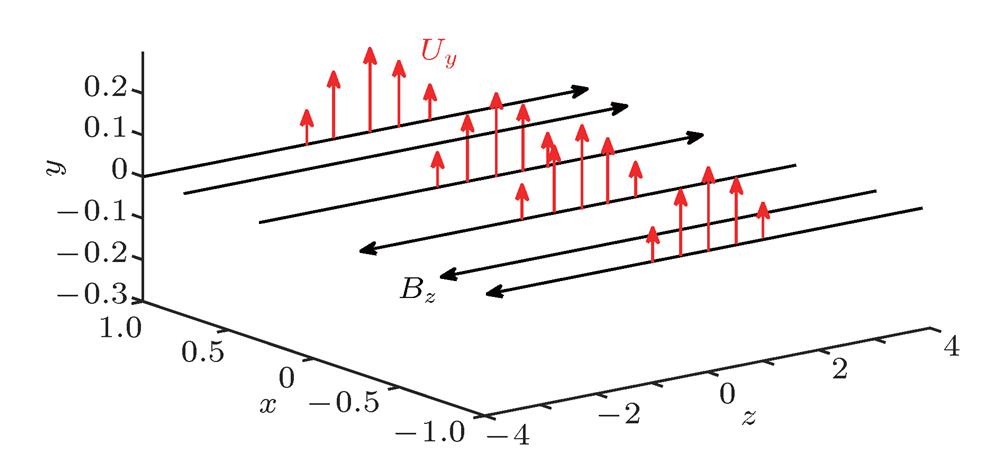
Fig. 1. Profiles of the out-of-plane driving flows.
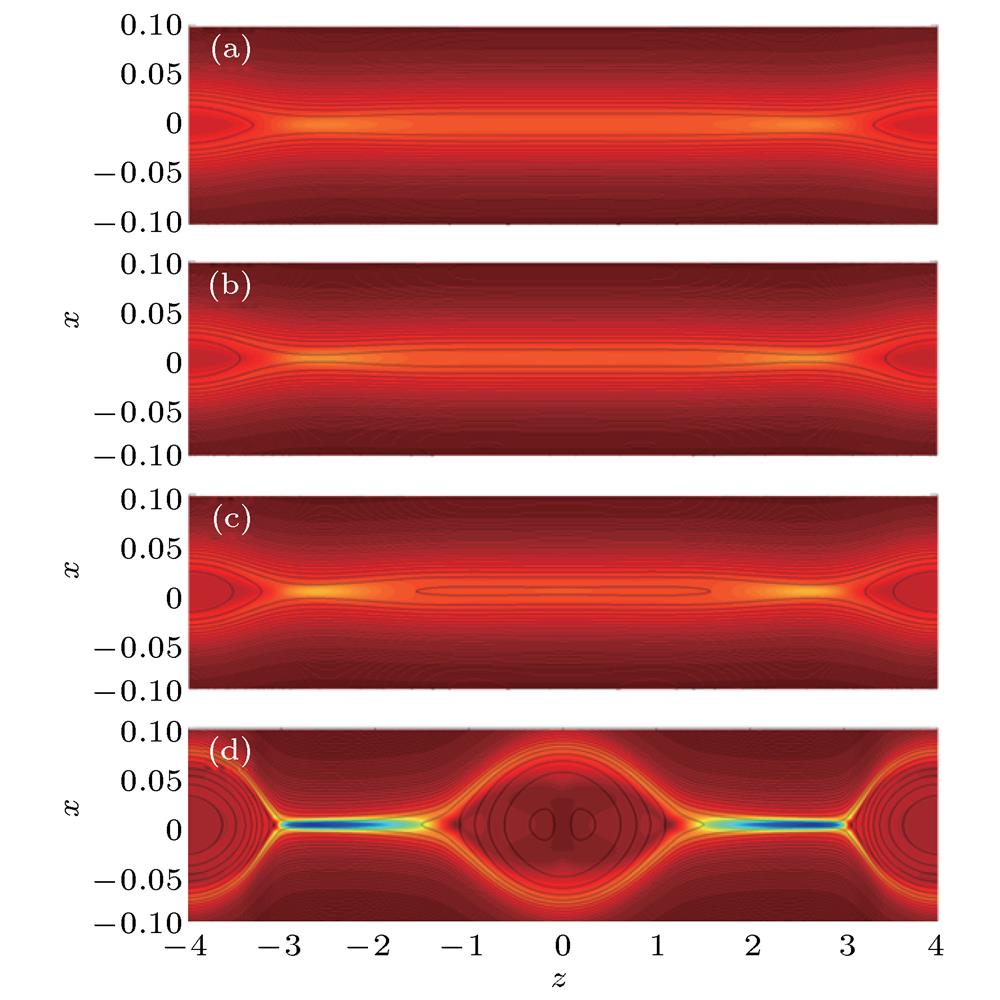
Fig. 2. The magnetic configuration without driving flow at (a) t = 70, (b) t = 74, (c) t = 80, (d) t = 120. The black lines and background colors indicate the magnetic field line in the reconnection plane and the current density in out-of-plane direction, respectively.
Fig. 3. Evolution of magnetic configuration with out-of-plane driving flow for L S = 0.05, U 0 = 0.1 at (a) t = 70, (b) t = 80, (c) t = 110. The black lines and background colors indicate the magnetic field line in the reconnection plane and the current density in out-of-plane direction, respec-tively.
Fig. 4. The magnetic configuration with out-of-plane dri-ving flow for L S = 0.3, U 0 = 0.1 at (a) t = 80, (b) t = 110, (c) t = 118. The black lines and background colors indicate the magnetic field line in the reconnection plane and the current density in out-of-plane direction, respectively.
Fig. 5. The evolution of reconnected flux with different driving flow strength.
Fig. 6. The magnetic configuration with out-of-plane dri-ving flow with different strength for L S = 0.3 in the same phase. The black lines and background colors indicate the magnetic field line in the reconnection plane and the current density in out-of-plane direction, respectively: (a) Without driving flow at t = 120; (b) with U 0 = 0.1 at t = 118; (c) with U 0 = 0.2 at t = 97; (d) with U 0 = 0.3 at t = 88.
Fig. 7. The magnetic configuration is effected by out-of-plane driving flow with L S = 0.05, U 0 = 0.1 and guilding field By = 0.1 at (a) t = 100, (b) t = 110, (c) t = 119. The black lines and background colors indicate the magnetic field line in the reconnection plane and the current density in out-of-plane direction, respectively.
Fig. 8. Evolution of the magnetic configuration with out-of-plane driving flow for L S = 0.3, U 0 = 0.1 and guilding field By = 0.1 at (a) t = 70; (b) t = 80; (c) t = 88. The black lines and background colors indicate the magnetic field line in the reconnection plane and the current density in out-of-plane direction, respectively.
Fig. 9. (a) Evolution of the reconnection flux with out-of-plane driving flow for L S = 0.05, U 0 = 0.1 and different guilding field; (b) evolution of the reconnection flux with different driving flow strength and guilding field By = 0.1; (c) dependence of the growth rate of plasmoid on different driving flow strength with guilding field By = 0.1.

Set citation alerts for the article
Please enter your email address
© Copyright 2018-2021 | Chinese Laser Press. All Rights Reserved 沪ICP备15018463号-20