• Spectroscopy and Spectral Analysis
  • Vol. 41, Issue 8, 2604 (2021)
Tian XIA1、1; *;, Ke-ming YANG2、2;, Fei-sheng FENG3、3;, Hui GUO4、4;, and Chao ZHANG2、2;
Author Affiliations
  • 11. China Centre for Resources Satellite Data and Application, Beijing 100094, China
  • 22. College of Geoscience and Surveying Engineering, China University of Mining and Technology (Beijing), Beijing 100083, China
  • 33. State Key Laboratory of Mining Response and Disaster Prevention and Control in Deep Coal Mine, Anhui University of Science and Technology, Huainan 232001, China
  • 44. School of Surveying and Mapping, Anhui University of Science and Technology, Huainan 232001, China
  • show less
    DOI: 10.3964/j.issn.1000-0593(2021)08-2604-07 Cite this Article
    Tian XIA, Ke-ming YANG, Fei-sheng FENG, Hui GUO, Chao ZHANG. A New Copper Stress Vegetation Index NCSVI Explores the Sensitive Range of Corn Leaves Spectral Under Copper Pollution[J]. Spectroscopy and Spectral Analysis, 2021, 41(8): 2604 Copy Citation Text show less
    The growth process of corn
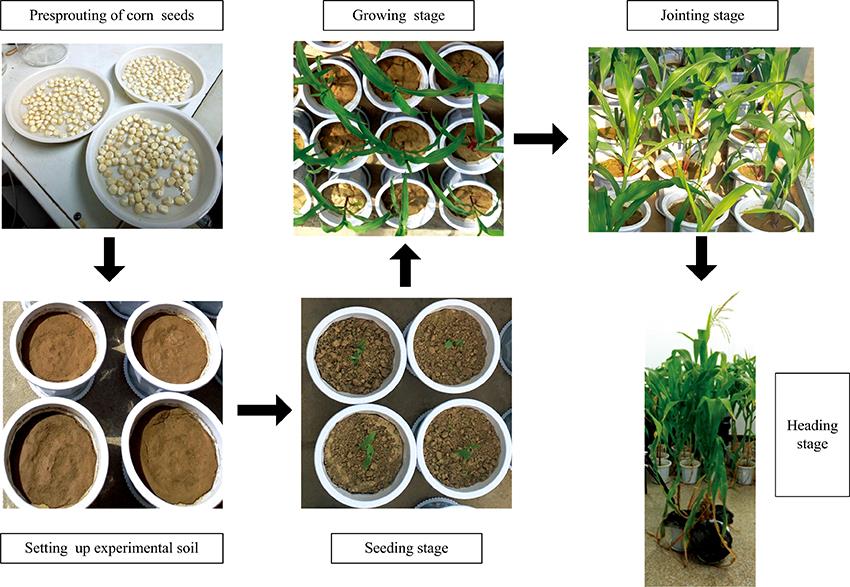
    Fig. 1. The growth process of corn
    The Spectral of corn leaves in 2016
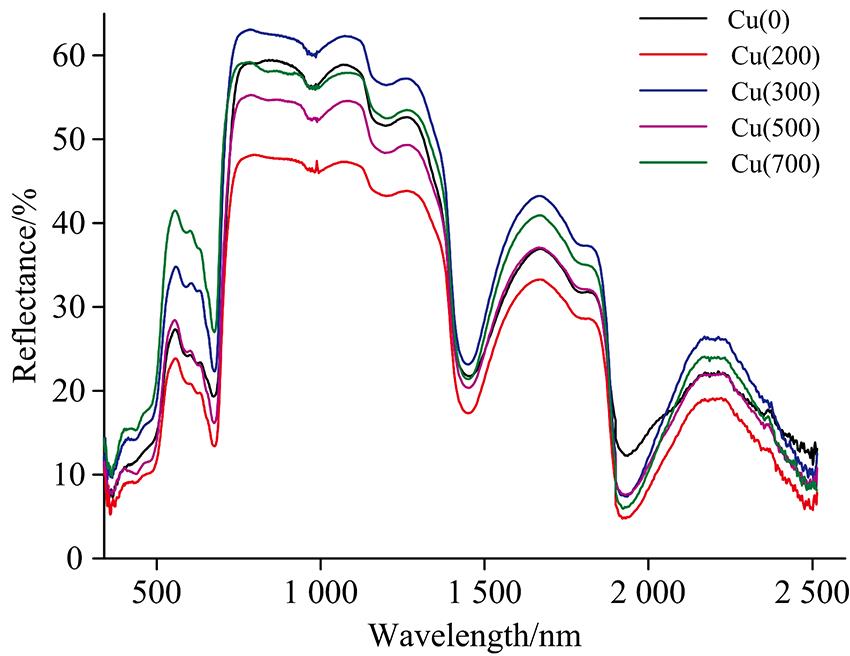
    Fig. 2. The Spectral of corn leaves in 2016
    The Spectral of corn leaves in 2014
    Fig. 3. The Spectral of corn leaves in 2014
    Schematic diagram of the spectral subintervals in corn leaves
    Fig. 4. Schematic diagram of the spectral subintervals in corn leaves
    Correlation between VIs and Cu2+ contents in corn leaves by experiment in 2016
    Fig. 5. Correlation between VIs and Cu2+ contents in corn leaves by experiment in 2016
    Correlation between VIs and Cu2+ contents in corn leaves by experiment in 2014
    Fig. 6. Correlation between VIs and Cu2+ contents in corn leaves by experiment in 2014
    样品
    年份
    样品编号胁迫浓度/
    (μg·g-1)
    Cu2+含量/
    (μg·g-1)
    2016Cu(0)09.77
    Cu(200)20031.29
    Cu(300)30075.78
    Cu(500)50054.51
    Cu(700)700114.79
    2014Cu(0)01.08
    Cu(250)2504.96
    Cu(500)5009.46
    Table 1. Cu2+ contents in corn leaves
    植被指数名称计算公式
    WBI水波段指数R900/R970
    MCARI改进的叶绿素吸收率指数((R700-R670)-0.2(R700-R550))(R700/R670)
    NDWI归一化水指数(R860-R1 240)/(R860+R1 240)
    Table 2. Computing formula of vegetation indexes
    指数子区间Cu(0)Cu(200)Cu(300)Cu(500)Cu(700)RRMSE
    NCSVI350~430 nm(紫谷)0.330.370.270.340.16-0.8817.09
    430~530 nm(蓝边)0.290.330.230.320.12-0.8519.22
    530~580 nm(绿峰)0.120.120.040.10-0.09-0.94*12.57
    580~650 nm(黄边)0.160.260.060.15-0.06-0.8817.47
    650~690 nm(红谷)0.210.270.150.250.03-0.8419.64
    690~750 nm(红边)-0.05-0.07-0.12-0.07-0.17-0.97*8.71
    750~1 301 nm(近红外平台)-0.13-0.12-0.15-0.13-0.19-0.8717.97
    1 301~1 500 nm(近谷)0.110.110.070.110.01-0.94*12.71
    1 500~1 590 nm(近边)0.090.180.030.08-0.02-0.8220.68
    1 590~1 919 nm(近峰 A)0.060.050.010.04-0.05-0.96*10.06
    1 919~2 500 nm(近峰 B)0.180.280.120.170.06-0.7922.09
    WBI-1.051.031.031.041.03-0.6826.63
    MCARI-16.9528.0333.4929.7130.570.7524.21
    NDWI-0.060.040.040.050.04-0.6527.48
    Table 3. Statistics and correlation calculation results of NCSVI and conventional VIs by experiment in 2016
    指数子区间Cu(0)Cu(250)Cu(500)rRMSE
    NCSVI350~430 nm(紫谷)0.400.390.39-0.752.25
    430~530 nm(蓝边)0.360.350.360.612.71
    530~580 nm(绿峰)0.210.190.18-0.90*1.50
    580~650 nm(黄边)0.320.300.30-0.792.08
    650~690 nm(红谷)0.370.360.370.193.36
    690~750 nm(红边)0.040.020.01-0.97*0.85
    750~1 301 nm(近红外平台)-0.10-0.10-0.10-0.273.30
    1 301~1 500 nm(近谷)0.160.150.14-0.97*0.78
    1 500~1 590 nm(近边)0.130.120.11-0.891.58
    1 590~1 919 nm(近峰 A)0.090.080.08-0.93*1.29
    1 919~2 500 nm(近峰 B)0.230.210.21-0.802.04
    WBI-0.991.031.030.812.02
    MCARI-14.4312.7516.000.522.92
    NDWI-0.070.050.05-0.851.78
    Table 4. Statistics and correlation calculation results of NCSVI and conventional VIs by experiment in 2014
    Tian XIA, Ke-ming YANG, Fei-sheng FENG, Hui GUO, Chao ZHANG. A New Copper Stress Vegetation Index NCSVI Explores the Sensitive Range of Corn Leaves Spectral Under Copper Pollution[J]. Spectroscopy and Spectral Analysis, 2021, 41(8): 2604
    Download Citation