
Xuanang You, Peng Zhao, Xiaodong Mu, Kun Bai, Sai Lian. Heterogeneous Noise Iris Segmentation Based on Attention Mechanism and Dense Multiscale Features[J]. Laser & Optoelectronics Progress, 2022, 59(4): 0410006
- Laser & Optoelectronics Progress
- Vol. 59, Issue 4, 0410006 (2022)
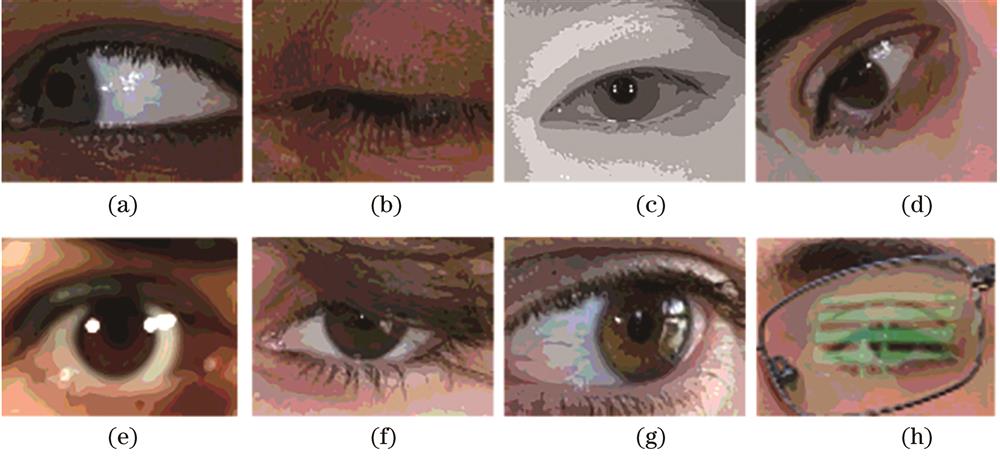
Fig. 1. Examples of eye image acquisition in complex scenes. (a) Gaze deviation; (b) absence of iris; (c) eyelash occlusion; (d) iris rotation; (e) blur; (f) hair shade; (g) specular reflection; (h) glasses occlusion
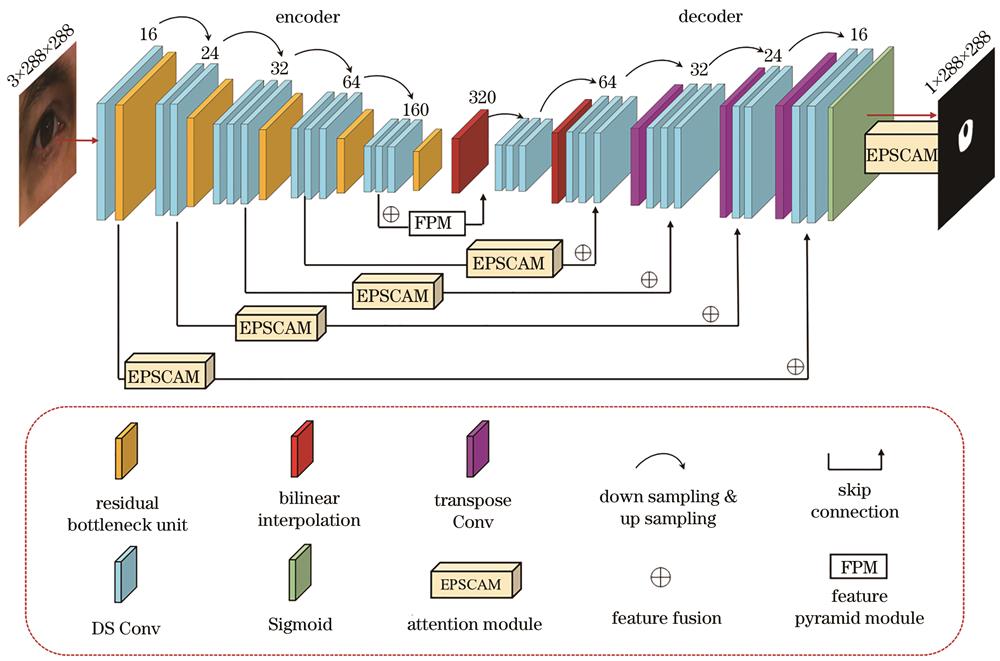
Fig. 2. MFFIris-Unet architecture
Fig. 3. Structure of inverted residual block
Fig. 4. Structure of the modified residual bottleneck unit
Fig. 5. Spatial-channel parallel attention module architecture
Fig. 6. Improved Dense-ASPP structure
Fig. 7. Examples of data enhanced training samples
Fig. 8. Curves of training loss function and precision change at different datasets. (a) CASIA; (b) UBIRIS; (c) MICHE
Fig. 9. Segmentation results of different methods on MICHE dataset. (a) Original image; (b) ground truth; (c) results of Deeplab V3; (d) results of U-Net; (e) results of RTV-L; (f) results of PI-Unet; (g) results of MFFIris-Unet
Fig. 10. Segmentation results of different methods on CASIA dataset. (a) Original image; (b) ground truth; (c) results of Deeplab V3; (d) results of U-Net; (e) results of RTV-L; (f) results of PI-Unet; (g) results of MFFIris-Unet
Fig. 11. Segmentation results of different methods on UBIRIS dataset. (a) Original image; (b) ground truth; (c) results of Deeplab V3; (d) results of U-Net; (e) results of RTV-L; (f) results of PI-Unet; (g) results of MFFIris-Unet
Fig. 12. Histograms of mIoU and average F1 scores on three datasets
Fig. 13. Visualized results predicted by the base model and MFFIris-Unet. (a) Original image; (b) ground truth; (c) results of base method; (d) results of MFFIris-Unet
| |||||||||||||||||||||||||||||||||||||||||||||||||||||||||||||||||||||||||||||||||||||||||||||||||||||||||||||||||||||||||||||||||||||||||||||||||||||||||||||||||||||||||||||||||||||||||||||||||||||||||||||||
Table 1. Evaluation index results of different methods on three iris datasets
|
Table 2. Comparison of the number of parameters, computation amount, and storage space of different methods
|
Table 3. Results of ablation experiments

Set citation alerts for the article
Please enter your email address
© Copyright 2018-2021 | Chinese Laser Press. All Rights Reserved 沪ICP备15018463号-20