• Laser & Optoelectronics Progress
  • Vol. 57, Issue 9, 093002 (2020)
Meiling Tian1、2、3、**, Xiangyu Ge1、2、3, Jianli Ding1、2、3、*, Jingzhe Wang1、2、3, and Zhenhua Zhang1、2、3
Author Affiliations
  • 1College of Resource and Environment Sciences, Xinjiang University, Urumqi, Xinjiang 830046, China
  • 2Key Laboratory of Oasis Ecology, Xinjiang University, Urumqi, Xinjiang 830046, China
  • 3Key Laboratory of Smart City and Environment Modelling of Higher Education Institute, Xinjiang University, Urumqi, Xinjiang 830046, China
  • show less
    DOI: 10.3788/LOP57.093002 Cite this Article Set citation alerts
    Meiling Tian, Xiangyu Ge, Jianli Ding, Jingzhe Wang, Zhenhua Zhang. Coupled Machine Learning and Unmanned Aerial Vehicle Based Hyperspectral Data for Soil moisture Content Estimation[J]. Laser & Optoelectronics Progress, 2020, 57(9): 093002 Copy Citation Text show less
    Statistical characteristics of SMC
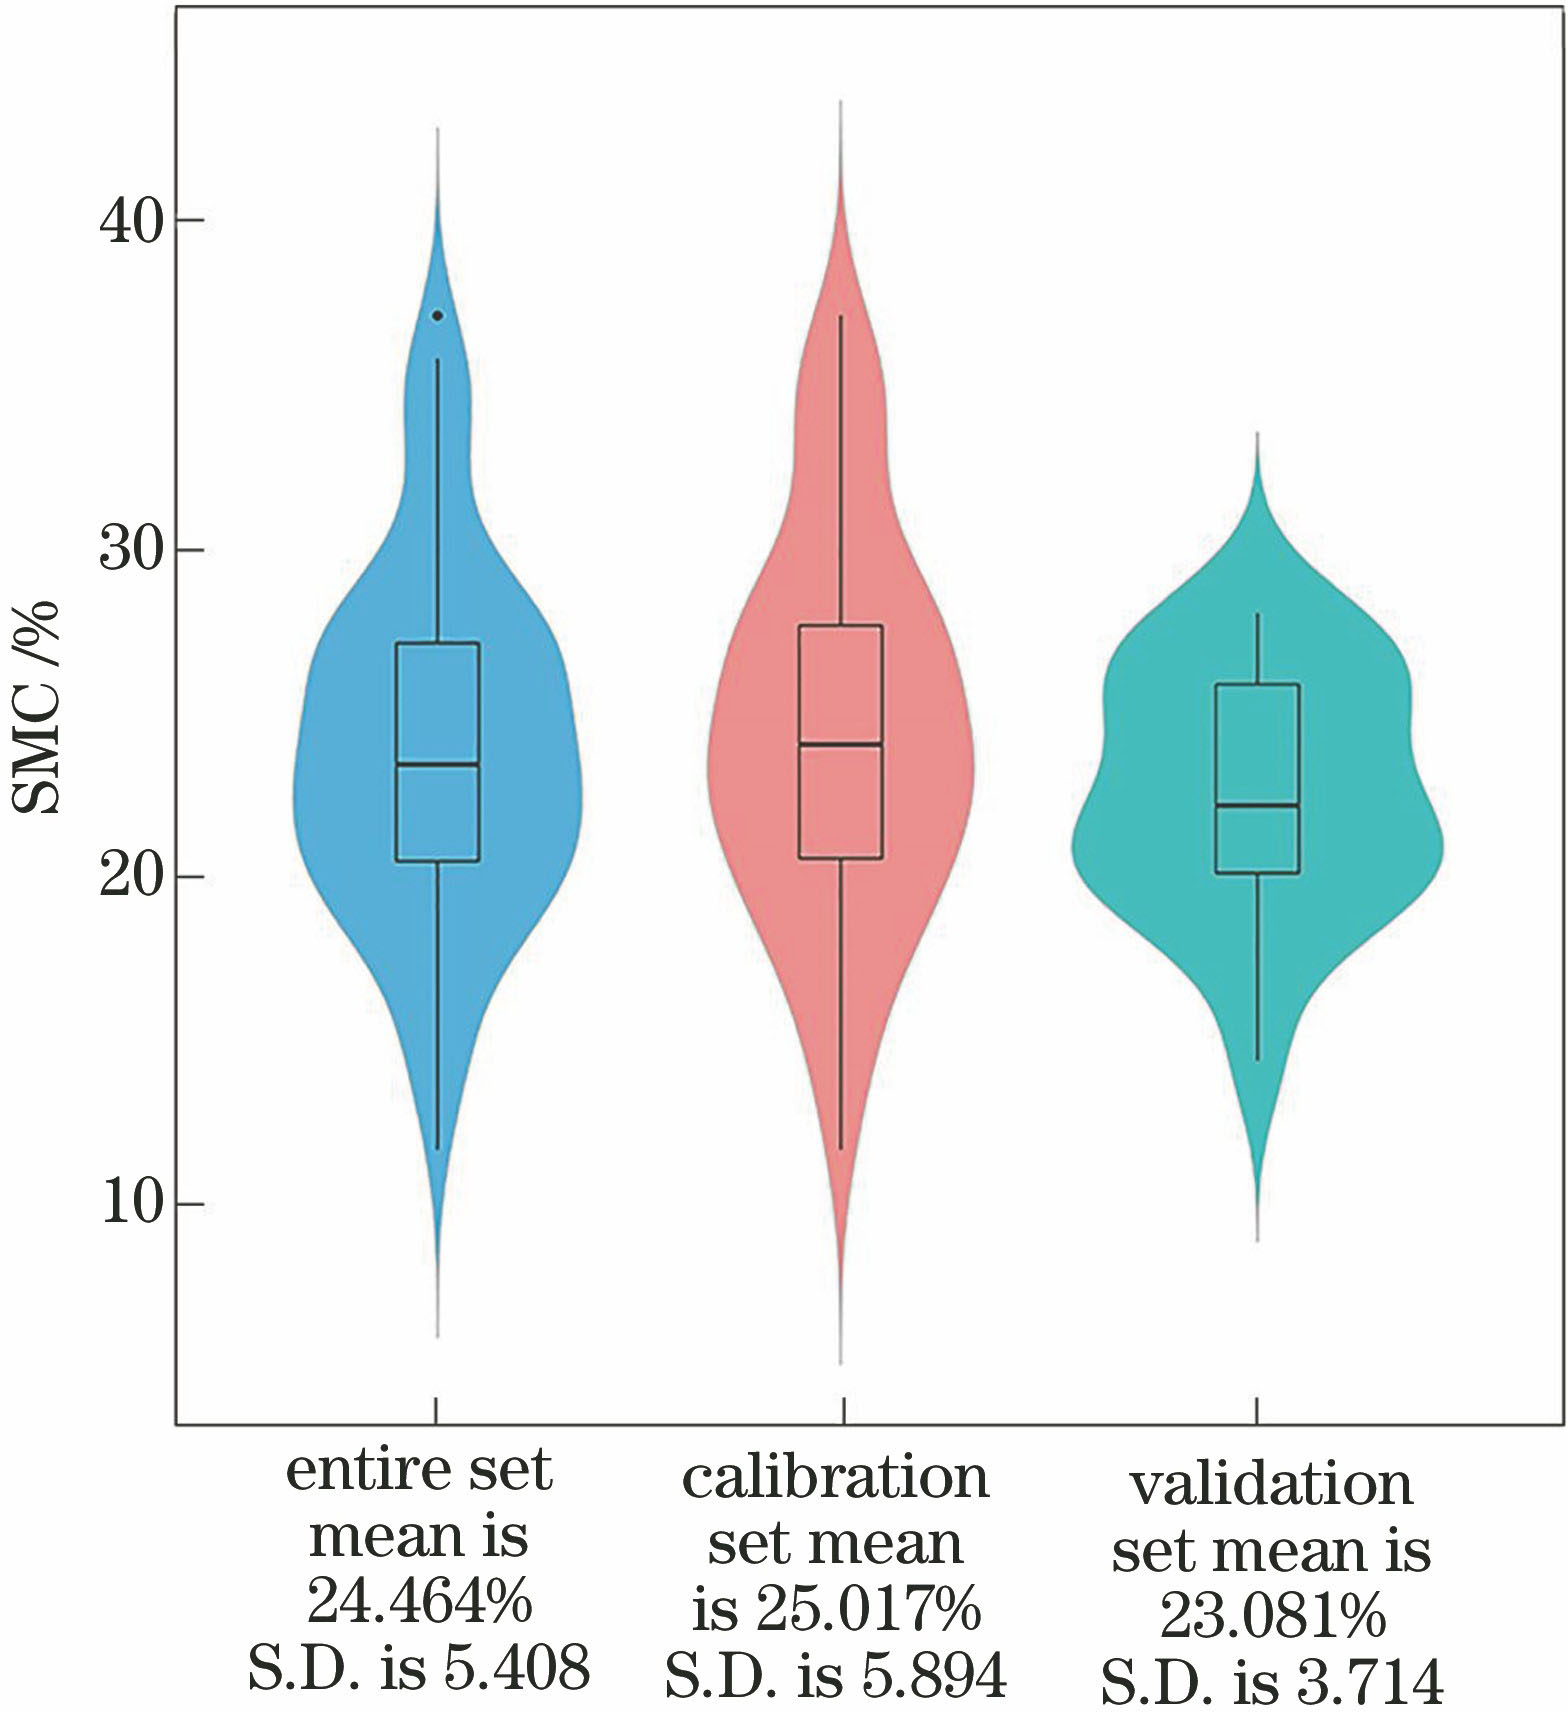
    Fig. 1. Statistical characteristics of SMC
    Hyperspectral images based on different pretreatments. (a) Three-dimensional image; (b) R; (c) FDR; (d) SDR; (e) CR; (f) A; (g) FDA; (h) SDA
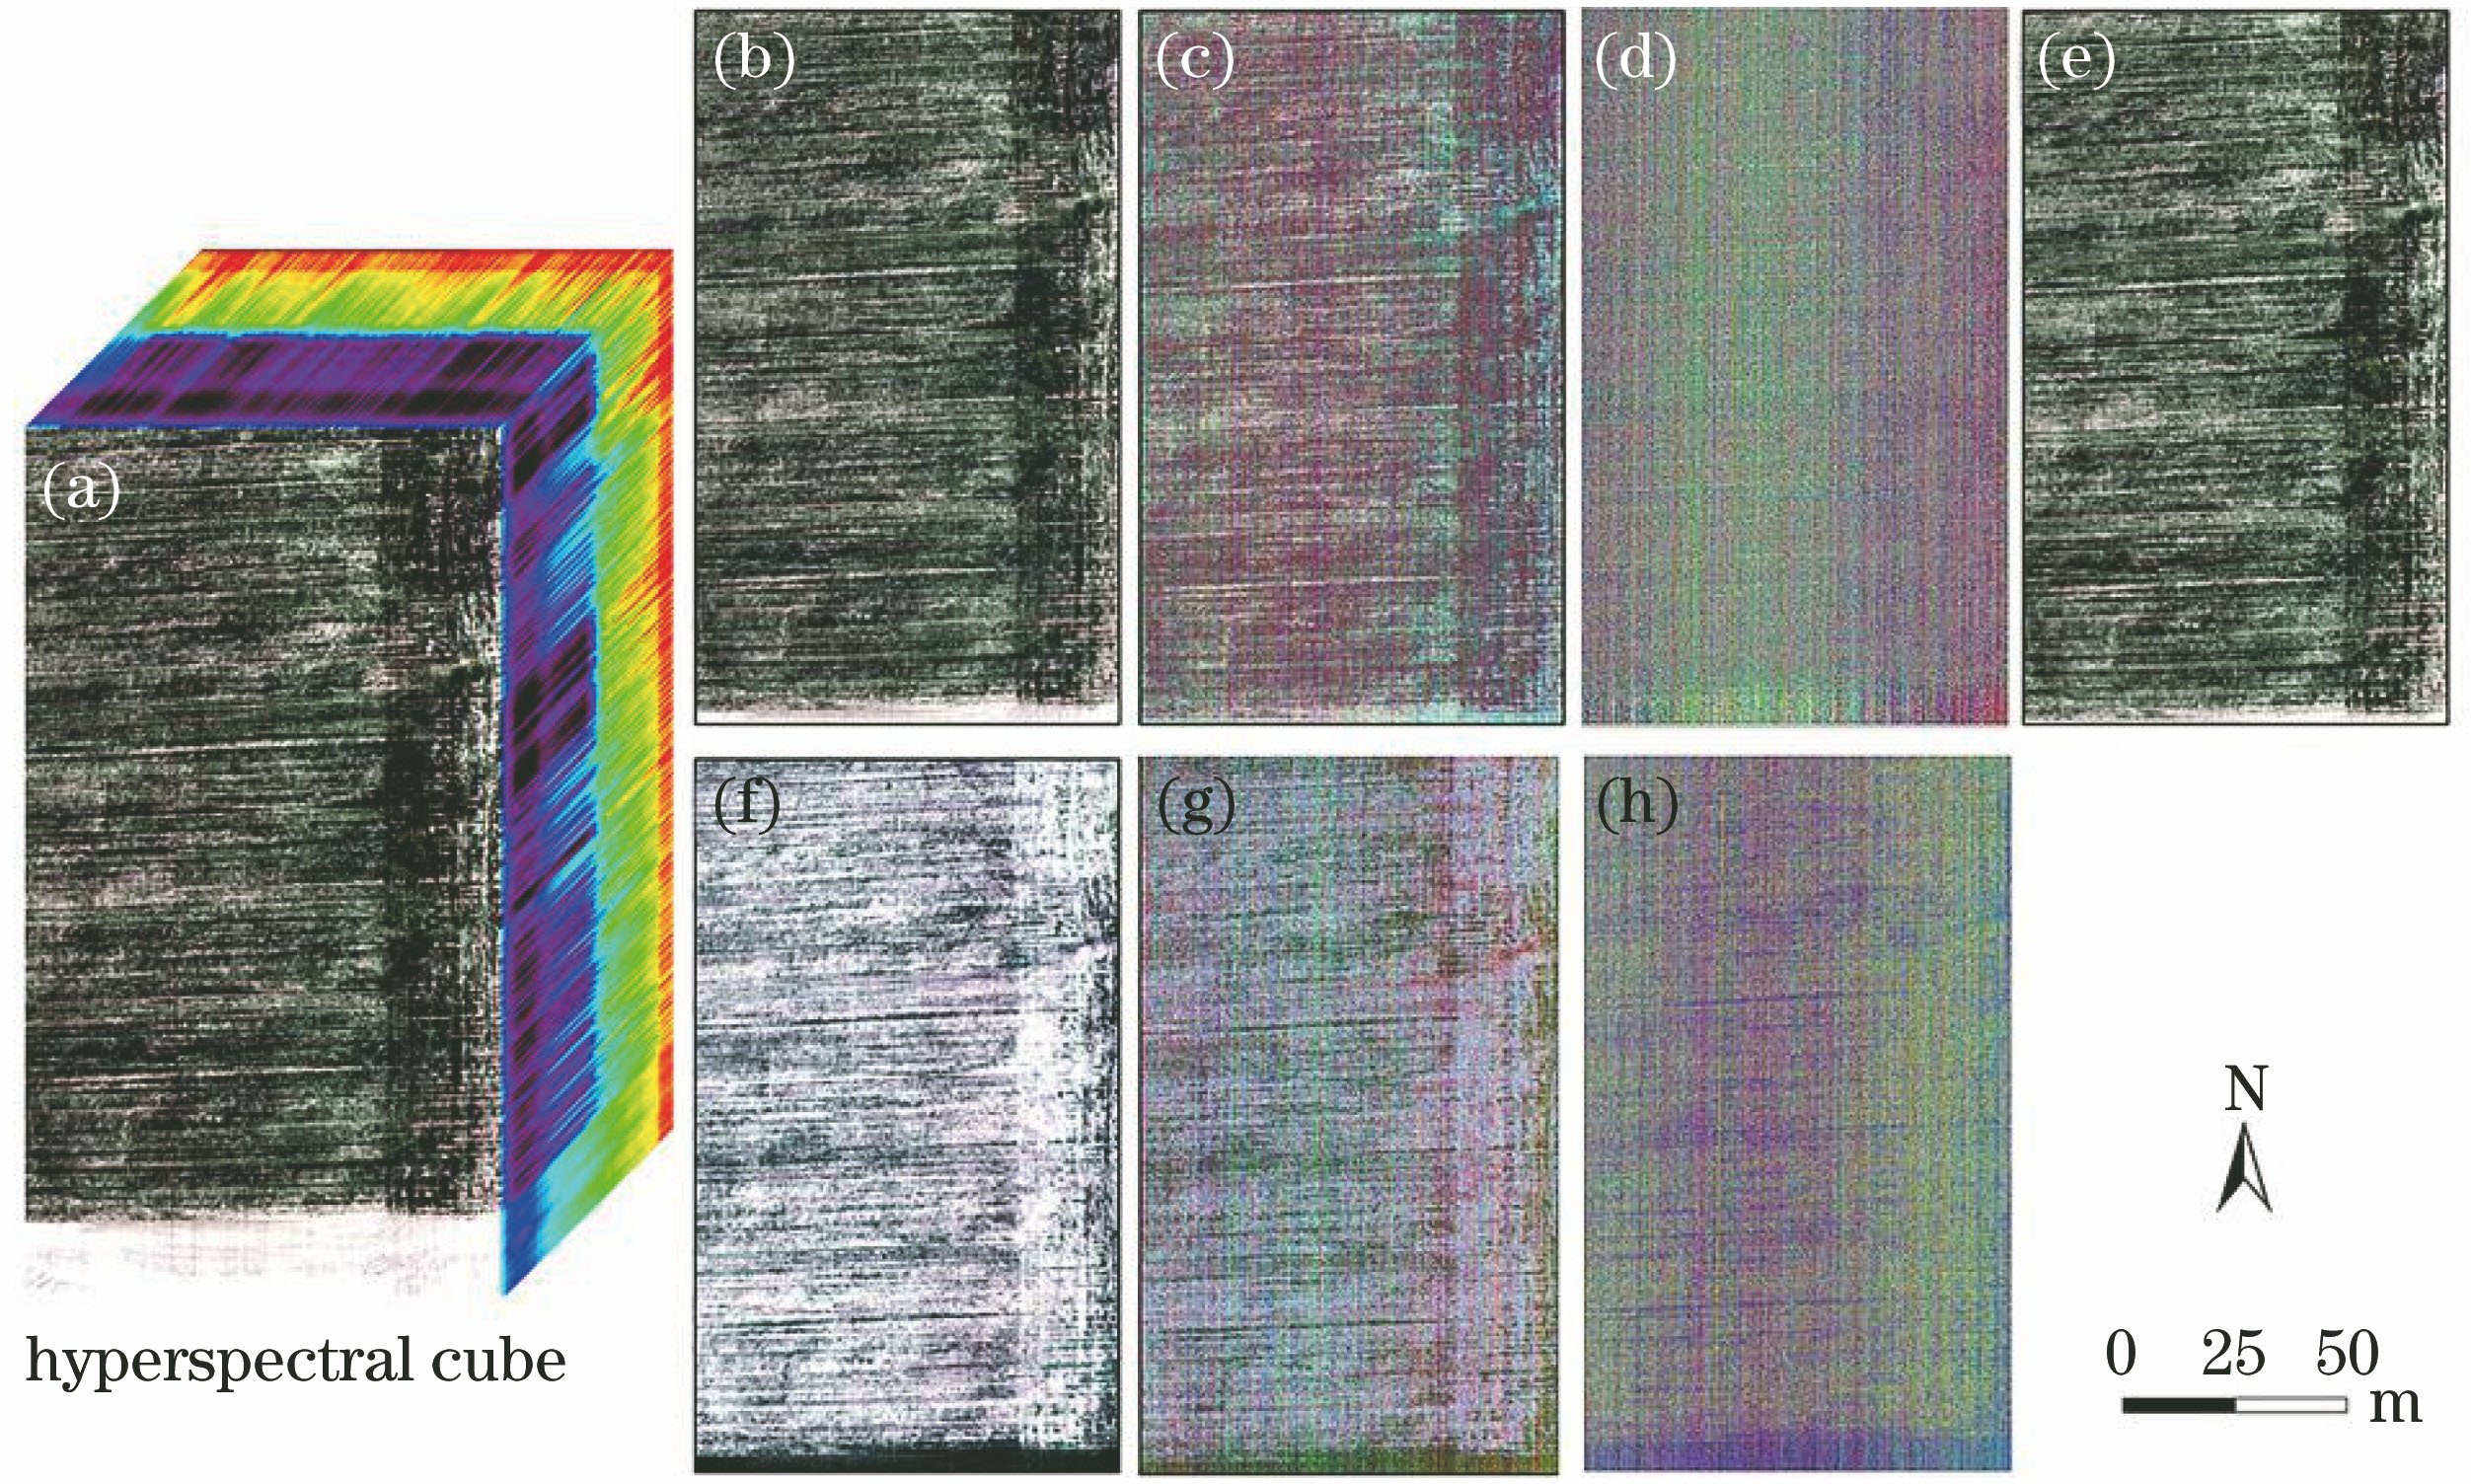
    Fig. 2. Hyperspectral images based on different pretreatments. (a) Three-dimensional image; (b) R; (c) FDR; (d) SDR; (e) CR; (f) A; (g) FDA; (h) SDA
    Spectral curves based on different pretreatments. (a) R; (b) FDR; (c) SDR; (d) CR; (e) A; (f) FDA; (g) SDA
    Fig. 3. Spectral curves based on different pretreatments. (a) R; (b) FDR; (c) SDR; (d) CR; (e) A; (f) FDA; (g) SDA
    Characteristic bands selected by different algorithms. (a)-(c) Characteristic bands of R after RF, GBRT, XGBoost screening; (d)-(f) characteristic bands of FDR after RF, GBRT, XGBoost screening; (g)-(i) characteristic bands of SDR after RF, GBRT, XGBoost screening; (J)-(l) characteristic bands of CR after RF, GBRT, XGBoost screening; (m)-(o) characteristic bands of RF, GBRT, XGBoost screening; (p)-(r) characteristic bands of FDA after RF, GBRT, XGBoost screening; (s)-(u) characteristic band of S
    Fig. 4. Characteristic bands selected by different algorithms. (a)-(c) Characteristic bands of R after RF, GBRT, XGBoost screening; (d)-(f) characteristic bands of FDR after RF, GBRT, XGBoost screening; (g)-(i) characteristic bands of SDR after RF, GBRT, XGBoost screening; (J)-(l) characteristic bands of CR after RF, GBRT, XGBoost screening; (m)-(o) characteristic bands of RF, GBRT, XGBoost screening; (p)-(r) characteristic bands of FDA after RF, GBRT, XGBoost screening; (s)-(u) characteristic band of S
    SMC estimation results based on different preferred methods. (a)-(c) SMC estimation effect of R optimized by RF, GBRT and XGBoost; (d)-(f) SMC estimation effect of FDR optimized by RF, GBRT and XGBoost; (g)-(i) SMC estimation effect of SDR optimized by RF, GBRT and XGBoost; (j)-(l) SMC estimation effect of CR optimized by RF, GBRT and XGBoost; (m)-(o) SMC estimation effect of A optimized by RF, GBRT and XGBoost; (p)-(r) SMC estimation effect of FDA optimized by RF, GBRT and XGBoost; (s)-(u) SMC
    Fig. 5. SMC estimation results based on different preferred methods. (a)-(c) SMC estimation effect of R optimized by RF, GBRT and XGBoost; (d)-(f) SMC estimation effect of FDR optimized by RF, GBRT and XGBoost; (g)-(i) SMC estimation effect of SDR optimized by RF, GBRT and XGBoost; (j)-(l) SMC estimation effect of CR optimized by RF, GBRT and XGBoost; (m)-(o) SMC estimation effect of A optimized by RF, GBRT and XGBoost; (p)-(r) SMC estimation effect of FDA optimized by RF, GBRT and XGBoost; (s)-(u) SMC
    Distribution of characteristic bands
    Fig. 6. Distribution of characteristic bands
    Independent variableModeling setValidation set
    R2RMSE /%R2RMSE /%RPIQ
    R-RF0.6903.3070.6942.0681.682
    R-GBRT0.7003.2140.6982.0191.890
    R-XGBoost0.6533.4400.6572.2301.410
    FDR-RF0.6213.6140.6212.2371.401
    FDR-GBRT0.8002.6240.8011.6543.007
    FDR-XGBoost0.7712.8020.7721.7642.943
    SDR-RF0.7123.1320.7122.0651.895
    SDR-GBRT0.7442.9730.7451.902.724
    SDR-XGBoost0.6903.2680.6922.5631.688
    CR-RF0.7263.0620.7241.9322.212
    CR-GBRT0.6813.3120.6802.2021.436
    CR-XGBoost0.6883.2760.6892.3221.483
    A-RF0.6943.2390.6922.0761.724
    A-GBRT0.6853.2800.6882.1911.437
    A-XGBoost0.6903.2570.6912.0531.588
    FDA-RF0.8422.4340.8431.4543.115
    FDA-GBRT0.8902.0240.8901.3373.490
    FDA-XGBoost0.7642.8520.7641.8352.801
    SDA-RF0.5993.7270.5982.3171.362
    SDA-GBRT0.7382.9980.7401.8812.315
    SDA-XGBoost0.8602.2850.8611.6323.238
    Table 1. GWR model of optimal variable SMC under different preferred methods
    Meiling Tian, Xiangyu Ge, Jianli Ding, Jingzhe Wang, Zhenhua Zhang. Coupled Machine Learning and Unmanned Aerial Vehicle Based Hyperspectral Data for Soil moisture Content Estimation[J]. Laser & Optoelectronics Progress, 2020, 57(9): 093002
    Download Citation