1Key Lab of Guangdong for Utilization of Remote Sensing and Geographical Information System, Guangdong Open Laboratory of Geospatial Information Technology and Application, Guangzhou Institute of Geography, Guangdong Academy of Sciences, Guangzhou 510070, China
2Southern Marine Science and Engineering Guangdong Laboratory, Guangzhou 511458, China
3School of Architecture and Urban Planning, Guangdong University of Technology, Guangzhou 510090, China
Yuyao YE, Changjian WANG, Hong’ou ZHANG, Ji YANG, Zhengqian LIU, Kangmin WU, Yingbin DENG. Spatiotemporal analysis of COVID-19 risk in Guangdong Province based on population migration[J]. Journal of Geographical Sciences, 2020, 30(12): 1985
Copy Citation Text
Population migration, especially population inflow from epidemic areas, is a key source of the risk related to the coronavirus disease 2019 (COVID-19) epidemic. This paper selects Guangdong Province, China, for a case study. It utilizes big data on population migration and the geospatial analysis technique to develop a model to achieve spatiotemporal analysis of COVID-19 risk. The model takes into consideration the risk differential between the source cities of population migration as well as the heterogeneity in the socioeconomic characteristics of the destination cities of population migration. It further incorporates a time-lag process based on the time distribution of the onset of the imported cases. In theory, the model will be able to predict the evolutional trend and spatial distribution of the COVID-19 risk for a certain time period in the future and provide support for advanced planning and targeted prevention measures. The research findings indicate the following: (1) The COVID-19 epidemic in Guangdong Province reached a turning point on January 29, 2020, after which it showed a gradual decreasing trend. (2) Based on the time-lag analysis of the onset of the imported cases, it is common for a time interval to exist between case importation and illness onset, and the proportion of the cases with an interval of 1-14 days is relatively high. (3) There is evident spatial heterogeneity in the epidemic risk; the risk varies significantly between different areas based on their imported risk, susceptibility risk, and ability to prevent the spread. (4) The degree of connectedness and the scale of population migration between Guangdong’s prefecture-level cities and their counterparts in the source regions of the epidemic, as well as the transportation and location factors of the cities in Guangdong, have a significant impact on the risk classification of the cities in Guangdong. The first-tier cities - Shenzhen and Guangzhou - are high-risk regions. The cities in the Pearl River Delta that are adjacent to Shenzhen and Guangzhou, including Dongguan, Foshan, Huizhou, Zhuhai, Zhongshan, are medium-risk cities. The eastern, northern, and western parts of Guangdong, which are outside of the metropolitan areas of the Pearl River Delta, are considered to have low risks. Therefore, the government should develop prevention and control measures that are specific to different regions based on their risk classification to enable targeted prevention and ensure the smooth operation of society.
In December 2019, the first case of pneumonia of unknown etiology, i.e., coronavirus disease 2019 (COVID-19), occurred in Wuhan South China Seafood Market (Li et al., 2020a). Based on the most updated COVID-19 data from the National Health Commission of China, as of March 5, 2020, there had been 80,552 confirmed cases and 3,042 deaths in China. The rapid spread of the COVID-19 epidemic constituted an unprecedented emergency. It was another public health emergency following the outbreak of severe acute respiratory syndrome (SARS) in 2003. Since the COVID-19 outbreak, many scholars have performed statistical analyses based on classical epidemiological investigations. They have studied the emergency response from the perspectives of pathology, epidemiology, genomics, clinical medicine, and molecular biology (Huang et al., 2020; Li et al., 2020a; Wu et al., 2020; Zhou et al., 2020b) in the hope of sequencing the viral genome and identifying the source of the virus, any interim hosts, and factors that affect transmission of the virus. The purpose of the above research is to identify the risk potential, transmission mechanism, and risk factors of COVID-19 and to provide scientific evidence for the development of test kits and anti-viral medicines. The research has gradually yielded some important conclusions, including that there exists human-to-human transmission and that the median incubation period is 4.0 days (Chan et al., 2020; Chen et al., 2020; Guan et al., 2020). Some researchers have used COVID-19 data published by the Chinese governments to build models for forecasting the pandemic risk (Yan et al., 2020); others have analyzed the impact on China’s economy to make policy recommendations (Duan et al., 2020). Using data on global trade and supply chains, Guan et al. evaluated the impact of COVID-19 on the economies of 140 countries across the globe based on different scenarios. Their research indicated that the breaking of the supply chains and the depressed consumer demand will reduce the output of electronic products by China’s manufacturing sector by 13%-15% (Guan et al., 2020a). Given the strong infectiousness of the virus, the rapid spread of the epidemic, and its significant impact on society and the economy, it is imperative to grasp the spatiotemporal pattern of the spread to implement localized, targeted prevention measures and ensure the smooth operation of the society.
This type of infectious disease, which spreads rapidly over a wide area, be it SARS - another coronavirus disease like COVID-19 - influenza caused by the avian influenza virus (Cao et al., 2010a), or infection with Zika virus, an arbovirus (Zhang et al., 2017), all result from the interaction between complex human factors and natural factors (Dalziel et al., 2018; Cao et al., 2010b). Population migration also poses high potential risks of epidemic spread (Tian et al., 2018; Zhang et al., 2017). For instance, Dalziel et al. found that the population size and structure as well as humidity in the cities had a strong impact on the intensity of influenza in the US during 2003-2008 (Dalziel et al., 2018). Tian et al. (2018) indicated that population migration in the urbanization process between 1963 and 2010 had a significant impact on the spread of the Hantavirus. Zhang et al. study the spread of the Zika virus in the Americas during 2013-2014. They found that the Zika virus was characterized by slow growth and significant heterogeneity across different spaces or seasons. Further, mosquitos and population migration were the major contributing factors. Building on those findings, the researchers forecasted the change patterns of Zika virus in the foreseeable future (Zhang et al., 2017). Using big data on population migration and limited real-time information on the COVID-19 epidemic, Zhou et al. (2020c) found that the size of the migratory population was significantly correlated with the number of confirmed cases.
Given the human-to-human transmission of COVID-19, before effective vaccines or medicines are available, the most effective ways of preventing the spread are still the traditional measures, including isolating infected persons, tracking close contacts, and restricting mass gatherings (Chinazzi et al., 2020; Yang et al., 2020). This type of preventive measure that is based on “social distancing” (Shetty, 2009) has proven effective in the prevention of the SARS outbreak in 2003 (Peng et al., 2003; Twu et al., 2003; Meng et al., 2005) and the spread of influenza A (H1N1) in 2009 (Cao et al., 2010a). Of the many studies on SARS and H1N1, in addition to the mainstream research based on pathology and epidemiology, there is also some research that is based on geography (Wang et al., 2003; Ding et al., 2004; Han et al., 2004). This type of research focuses on the spatial-distance aspect of the spread of epidemics. Other researchers have used the spatial address information of the infected persons to analyze the spatial configuration of the epidemic outbreaks and the spatiotemporal patterns of the epidemic spread. They conclude that spatial spread is inextricably correlated with population distribution, the environment, the distribution of hospitals, and other spatial factors (Cao et al., 2008; Cao et al., 2010a). However, the above research has mainly focused on samples of infected persons. Research on the impact of large-scale and high-frequency population migration on the transmission and spread of the epidemic is still lacking.
Nevertheless, the potential risk of COVID-19 spread due to population migration has caught the attention of Chinese governments. After Wuhan “shut down” its entire city on January 23, 2020, to block the spread of the epidemic, other prefecture-level cities (referred to as “cities” in the rest of the paper) in Hubei Province implemented the same lockdown measure, including Huanggang, Jingmen, Xiaogan, and Ezhou. However, before the lockdown, more than 5 million residents or visitors had left Wuhan for places across China, becoming potential spreaders of the virus. The existing confirmed cases in other provinces are all related to this population migration.
With the rapid advancement and popularization of the internet and mobile devices, using big data to realize emergency situational awareness and decision-making support (Zhou et al., 2020a) has become an effective approach to social governance. Vittoria et al. (2006) attempted to build a model for forecasting infectious diseases globally by using aviation transportation network data. Geng et al. (2016) used the civil aviation data of South Korea during June 2014 to retrospectively evaluate the relative probability of imported Middle East Respiratory Syndrome epidemics in the destination cities of Korean visitors to China. Zhou et al. (2020a) concluded that geographic information system (GIS) and big data technologies have played an important role in fighting the COVID-19 pandemic. Particularly, big data on population mobility from multiple sources (Buckee et al., 2020) (such as population migration data and real-time population migration data) have considerable advantages over data obtained through traditional epidemiological investigations in facilitating quick estimates of population mobility and spatial distribution, in space-based epidemic risk classification, and in determining the level of prevention needed (Zhou et al., 2020a).
This study focuses on the COVID-19 risk posed by the population that came (or returned) to Guangdong during the 2020 Spring Festival period. It uses the population migration big data and the GIS spatial analysis technology, takes into consideration the risk differential among source regions of the population inflows as well as the socioeconomic disparities between the receiving regions of population migration, and constructs a model for analyzing the spatiotemporal distribution of the epidemic risk in Guangdong from the perspectives of risk input and diffusion. The model can be used to reveal the spatiotemporal evolution of the potential epidemic spread risk imposed by the migrating population from Hubei Province. The overall purpose of this study is to use Guangdong’s experience as an example to facilitate the development and implementation of prevention measures that are specific to different regions based on their risk classification and support decision making for preventing the spread of COVID-19 in China.
2 Research methods and data sources
2.1 Overview of the study area and research framework
Guangdong boasts the largest mobile population in China. It has a total out-of-province migratory labor force of 16.69 million, of whom 2 million are from Hubei. According to the internet population migration index, it is estimated that between January 25, 2020 and February 6, 2020, a total of 190,000 people came to Guangdong from Hubei. The period of January 25 - January 29 saw the most population migration. The main source cities of the migration included Wuhan, Jingzhou, Xiangyang, Huanggang, Xiaogan, Suizhou, and Xianning, accounting for 85% of the total population that moved from Hubei to Guangdong. The major population-receiving cities in Guangdong were Shenzhen, Dongguan, Guangzhou, Foshan, Huizhou, and Zhongshan, accounting for 91% of the inflow population from Hubei. As of March 5, 2020, the total number of confirmed COVID-19 cases in Guangdong reached 1351, second only to Hubei’s 67,592 cases. Cases imported from Hubei accounted for the vast majority of the confirmed cases, and diffusion was mainly due to family gatherings. Therefore, preventing importing cases from outside Guangdong and diffusion within the province is still the basic strategy of containing the epidemic in Guangdong.
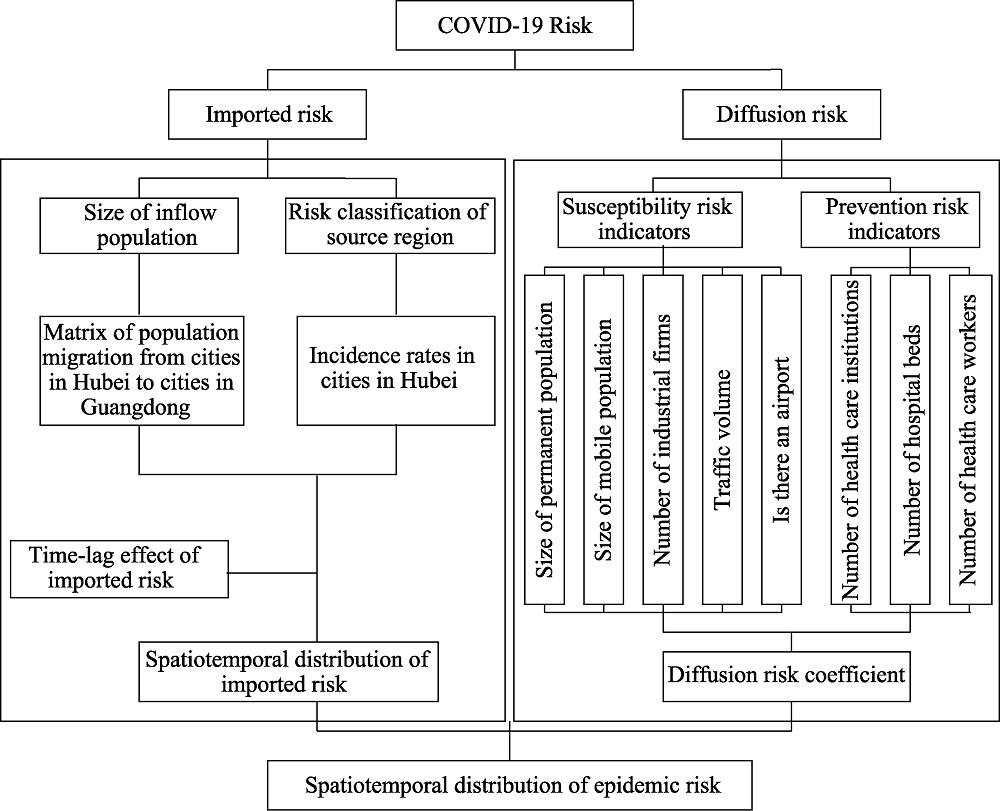
Based on the above basic prevention and control strategy, this paper develops an analytic framework from the perspectives of risk input and diffusion: (1) Using the big data of population migration and the geospatial analysis technique, the paper introduces the indicators of imported risk and diffusion risk to develop the spatiotemporal analytical model for the COVID-19 risk in Guangdong. (2) Based on the interval distribution of the onset of the imported cases, a lag period is further incorporated into the model to construct a spatiotemporal analytical model that takes into consideration the time-lag effect. The goal is to analyze and forecast the evolution patterns and spatiotemporal configuration of the COVID-19 risk. The research framework is illustrated in Figure 1.
Data for the matrix of population migration from cities in Hubei to cities in Guangdong are based on mobile phone signaling data supplied by mobile service providers. Mobile phone numbers from Hubei were tracked for their movement to ascertain the population that migrated into each city in Guangdong. The incidence rates in cities in Hubei come from the data published daily by the National Health Commission of China. The sizes of the permanent and mobile populations and the numbers of health care institutions, hospital beds, health care workers, and registered physicians were obtained from the statistical yearbooks of the cities in Guangdong. The number of industrial firms was taken from the China Industrial Enterprise Database; the spatial distribution of the firms was obtained through spatial geocoding. Traffic-volume data were based on the real-time information regarding toll collection by the expressway network. The epidemiological data on confirmed cases are based on information published by Shenzhen Health Commission (SHC) as of March 5, 2020, regarding 416 patients who contacted COVID-19. The information includes the date when each patient came to Shenzhen and the date of illness onset.
2.3 Research methods
2.3.1 Imported risk
To measure the size of the inflow population and to classify the risk levels of source cities, this study uses the matrix of population migration from cities in Hubei to cities in Guangdong and the incidence rates of cities in Hubei as indicators, respectively. Given Hubei was the source region with the most serious epidemic, the inflow population from Hubei is viewed as the imported risk. Further, considering the spatial heterogeneity in the intensity of the epidemic across cities in Hubei, the incidence rates of these cities are used as the weight of the imported risk. The imported risk (Riskinput, person) calculated in Figure 1 mainly reflects the imported risk posed by the inflow population between January 1, 2020 and February 29, 2020 around the Chinese New Year. A matrix of population migration from cities in Hubei to their counterparts in Guangdong is developed. The risk classification for the source cities (incidence rates of cities in Hubei) is then incorporated into the matrix to formulate the imported risk matrix:
where P denotes the matrix of daily population (people) migration from cities in Hubei to cities in Guangdong; the matrix contains Pij where $i$=1, 2, …21 denotes the 21 prefecture-level cities in Guangdong, and j=1, 2, …17 denotes the 17 prefecture-level cities in Hubei; αj is the j×1 column vector denoting the incidence rates of cities in Hubei. Based on the COVID-19 data released by the Health Commission of various governments, the incidence rates for Hubei were first determined. The determination of the imported risk is the key for Guangdong to prevent imported COVID-19.
2.3.2 Time-lag effect of imported risk
The characteristics of COVID-19, e.g., infectivity during the latent period, are correlated with the number of newly confirmed cases and the number of new infections (Li et al., 2020b). As such, in determining the imported risk, parameters that reflect the time-lag effect are required to more accurately describe the spatiotemporal patterns of COVID-19 spread in Guangdong. As Shenzhen is the most representative city of Guangdong, we use the data on the COVID-19 cases in Shenzhen for the analysis (Table 1). A probabilistic statistical analysis is performed to examine all imported cases and determine the time span from a case being imported into Guangdong to illness onset, so we can determine the distribution of this time lag. The estimated time lag is incorporated into the model upon parameter inversion and adjustments to more effectively simulate the evolution of the epidemic and forecast its patterns in the future.
Variable
Explanation
Value range and type
Case number
Released by Shenzhen Health Commission
Sex
Patient’s sex
Male/female
Age
Patient’s age
Integer, 0-100
Place of residency
Province-City, e.g., Guangdong-Shenzhen
Time in Wuhan
Time period, YYYY/MM/DD-YYYY/MM/DD
Data/time period
Time of arrival at Shenzhen
YYYY/MM/DD
Date
Time of illness onset
YYYY/MM/DD
Date
Cause of infection
0: Resided in or visited Wuhan; 1: Resided in or visited a place in Hubei outside of Wuhan 2: Had close contact with a person who resided in or visited Hubei but did not reside in or visit Hubei; 3: Had close contact with a confirmed case but did not reside in or visit Hubei; NA: Unknown
The lag between the import of a case and illness onset is denoted by f(t). Then all the cases confirmed before time t are from patients infected before t-f(t) (Yan et al., 2020). The probability distribution of the lag period f(t) is denoted by qf(t). Ultimately, the imported risk of the epidemic in different places can be obtained, as can the impact of the risk of its spread across different regions. The impact of the spread risk of all the regions can be superimposed on each other to obtain the risk value of each region°s outbreak in the spatial dimension, and the change in epidemic risk in each region over time in the temporal dimension can also be obtained. That is:
The diffusion risk is illustrated in Figure 1 ($Ris{{k}_{diffusion}}$, person). This study considers the fundamental conditions for diffusion in the cities and divides the diffusion risk into two aspects: the susceptibility risk and prevention risk:
where $Risk_{diffusion}^{j}$ denotes the size of population (people) that may contract COVID-19 in city i of Guangdong;$Risk_{input}^{i}$ denotes the imported risk posed by the population from Hubei to city i of Guangdong (people);$\beta _{diffusion}^{i}$ is the diffusion risk coefficient of city j in Guangdong, where
where $\beta _{diffusion-1}^{i}$ denotes the susceptibility risk coefficient of city i in Guangdong, and $\beta _{diffusion-\text{2}}^{i}$ denotes the prevention risk coefficient of city j in Guangdong. Indicators for susceptibility and prevention are selected based on the available results (Table 2). The susceptibility indicators have more to do with factors related to population mobility. Large population sizes and high mobility increase the chances of person-to-person contact (Zhao et al., 2020). The transportation network and traffic volume can further accelerate the spread of infectious diseases (Colizza et al., 2006; Geng et al., 2016). This study further incorporates the number of firms in the industrial sector into the model, the purpose of which is to examine the impact of reopening the economy in the Pearl River Delta region - a national manufacturing base - on the spread of COVID-19. The susceptibility indicators include the size of the local population, the size of the mobile population, the number of firms in the industrial sector, the traffic volume, and whether the city has an airport. These indicators should positively impact the spread of COVID-19. Prevention indicators have more to do with health care infrastructure. They include the number of health care institutions, number of hospital beds, and number of registered physicians. These indicators represent the capacity to prevent the spread of the epidemic and should negatively impact the spread. The relative coefficients $\beta _{diffusion-1}^{i}$ and $\beta _{diffusion-\text{2}}^{i}$ are derived after the susceptibility and prevention indicators are standardized.
where $Ris{{k}^{i}}$ denotes the overall epidemic risk of city i in Guangdong. This total risk calculation takes into consideration the imported risk and diffusion risk.
3 Spatiotemporal analysis of the COVID-19 risk in Guangdong from a geographic perspective
3.1 Time lag between case import and illness onset of imported cases
Since the novel coronavirus that caused the COVID-19 epidemic can be infectious during the latent period, after the imported risk is determined, we need to apply parameters that account for the time-lag effect to adjust the time distribution of the COVID-19 spread in Guangdong. Based on the review of imported cases in Shenzhen, we find that there is generally a common interval between the import of a case and the onset of illness. We examine this time interval for each imported case in Shenzhen and calculate the probability distribution of the time-lag period (Figure 2). The statistics indicate that 30.45% of the imported cases had a lag period of 0 days (illness onset occurred before or on the date the patient came to Shenzhen). If these cases could be identified and quarantined in a timely manner upon their entry into Shenzhen, the spread of the virus by them would be effectively contained. The imported cases that had a lag period of 1-14 days account for 65.38% of all cases. The 14-day isolation period, if properly implemented, would effectively prevent these patients from further spreading the virus. The rest of the cases had a lag period of 15 days and longer, the longest being 21 days. Although these cases only account for 4.17% of all cases, given that the 14-day isolation period is widely applied to mobile population across China, it is evident that existing measures would be insufficient to contain their spread of COVID-19 by epidemic diffusion. This issue deserves more attention.
Figure 2.
Probability distribution<italic> q<sub>f</sub></italic><sub>(</sub><italic><sub>t</sub></italic><sub>)</sub> of the lag period of COVID-19 cases imported into Shenzhen
Taking into account the time interval of disease onset among the imported cases, the daily imported risk for each city in Guangdong is calculated using formula (1). Then the imported risk is adjusted through formula (2), whereby the probability distribution of the lag period of cases imported into Shenzhen is used as the weight for the adjustment. The results are presented in Figure 3. A review of the population inflow indicates that, during the early stage of the virus transmission - the Chinese New Year period - the migration from Hubei to cities of Guangdong was consistent with historical trends, and the confirmed cases in each province had a strong positive correlation with the number of people flowing from Wuhan into that province (Zhou et al., 2020a). The population that migrated from Hubei to Guangdong was mainly from Wuhan, Jingzhou, Huanggang, and Xiangyang; the main destination cities in Guangdong included Shenzhen, Guangzhou, Dongguan, Foshan, and Huizhou. Imported cases were mainly concentrated in the core cities of the metropolitan area in the Pearl River Delta region.
Figure 3.
Trends of daily imported risk (<italic>Risk<sub>input</sub></italic>) of the COVID-19 epidemic in various cities in Guangdong Province
The daily imported risk can be roughly divided into three phases: (1) January 1 - January 10, 2020: the daily imported risk grew rapidly, especially in Shenzhen and Guangzhou. (2) January 10 - January 23, 2020: the daily imported risk fluctuated but overall was on the decline. (3) The daily imported risk declined dramatically. A before-and-after analysis intuitively indicates that the shutdown of Wuhan, a compulsory measure restricting population mobility, on January 23, 2020, played a significant part in breaking the spread of the pandemic.
The cumulative imported risk is shown in Figure 4. Guangzhou and Shenzhen accounted for most of the cumulative imported risk in Guangdong due to the significant daily imported risk of the two cities. The cumulative imported risk of the cities in Guangdong can be divided into two phases: (1) January 1 - January 10, 2020: the cumulative imported risk grew rapidly. (2) After January 29, 2020, the cumulative imported risk grew slowly. After the shutdown of cities in Hubei on January 23, 2020, the cumulative imported risk reached the theoretical turning point on January 29, 2020. This period was a key window to prevent and control the outbreak of the imported epidemic.
Figure 4.
Cumulative imported risk (<italic>Risk<sub>input</sub></italic>) situation of various cities in Guangdong Province
The results of the spatial analysis of the imported risk are shown in Figure 5. Shenzhen and Guangzhou are the regions with high imported risks. These cities have a permanent population of over 10 million. They had a large population inflow from Hubei around the Chinese New Year and therefore high imported risks. Cities with medium imported risks include Dongguan, Foshan, Huizhou, Zhuhai, and Zhongshan, which are mainly in the Pearl River Delta metropolitan area. These cities belong to the second echelon of cities in the Pearl River Delta metropolitan area in terms of population and the size of the economy. Cities with a low imported risk include Jiangmen, Zhanjiang, Shaoguan, Qingyuan, Chaozhou, Shantou, Shanwei, Zhaoqing, Meizhou, Maoming, Jieyang, Heyuan, Yunfu, and Yangjiang; these cities are mainly located in the eastern, western, and northern parts of Guangdong, outside of the Pearl River Delta metropolitan area. The degrees of population aggregation and economic vitality in these cities are significantly lower than those in the Pearl River Delta region, so their imported risks are low.
Figure 5.
Spatial distribution of cumulative imported risks by city (Guangdong Province)
The spatial analysis of the susceptibility and prevention indicators indicates that both types of indicators have significant spatial heterogeneity. The heterogeneity of the susceptibility indicators is mainly demonstrated by the following facts: The permanent population is mainly clustered in the metropolitan cities of the Pearl River Delta and the core cities in eastern and western Guangdong. The mobile population is mainly concentrated in Shenzhen, Guangzhou, and Dongguan. Industrial firms are mainly located in the core cities of the Pearl River Delta metropolitan area surrounding the Pearl River estuary. And the traffic volume is mainly concentrated in the metropolitan cities of the Pearl River Delta.
The heterogeneity of the prevention indicators is demonstrated by the fact that health care workers are mainly concentrated in the metropolitan cities of the Pearl River Delta, especially Guangzhou, Shenzhen, Foshan, and Dongguan. Spatial heterogeneity in health care institutions and hospital beds is less significant. The spatial analysis of the diffusion risk coefficient indicates that the global Moran’s I of the risk coefficient is positive, I=0.6363, corresponding to a standardized statistic Z=5.2026 and a significance level P of 0.0000. The diffusion risk demonstrates high-level heterogeneity.
Based on the analysis of the susceptibility risk coefficients and prevention risk coefficients, the diffusion risk coefficients for the cities across Guangdong are calculated based on formula (4). The diffusion risk coefficient has significant spatial heterogeneity due to the differences in population, industrialization, and traffic volume across the cities (Figure 6). Shenzhen, Guangzhou, Foshan, and Dongguan, where both the susceptibility risk coefficient and prevention risk coefficient are high, have high diffusion risk coefficients. All these cities are located in the Pearl River Delta metropolitan area. Cities outside of this area in eastern, western, and northern Guangdong have relatively low diffusion risk coefficients.
Figure 6.
Spatiotemporal distribution of diffusion risk coefficients in cities across Guangdong
3.4 Analysis of the spatiotemporal evolution of the epidemic risk
Based on formula (5) and the lag period of the imported cases, the daily diffusion risks of the cities across Guangdong are shown in Figure 7. The evolution of the daily diffusion risks is highly consistent with that of the daily imported risk, and they experienced three phases. The daily diffusion risk of Guangdong also mainly consists of the daily diffusion risks of Shenzhen and Guangzhou. After January 26, 2020, the daily diffusion risks all declined rapidly.
Figure 7.
Daily diffusion risk (<italic>Risk<sub>diffusion</sub></italic>) of cities across Guangdong Province
The diffusion risk and imported risk show significant spatial heterogeneity. Specifically, the simulated epidemic growth process of the cities in Guangdong demonstrates temporal heterogeneity. During the early period of COVID-19 spread, cities with high population mobility and a high concentration of industrial firms had a higher growth rate of confirmed cases. For instance, from January 1, 2020, the daily diffusion risk of Guangzhou and Shenzhen grew through January 9, after which it started to decline, with fluctuations. During the middle and late stages of the COVID-19 spread, the diffusion risk declined rapidly. These results suggest that, while these cities had higher diffusion risks during the early phase of the epidemic spread, they also had higher prevention risk coefficients and could still reduce imported cases through effective prevention measures. Foshan, Dongguan, and Zhuhai experienced similar evolution patterns to those of Shenzhen and Guangzhou. Some cities, such as Huizhou and Zhongshan, had few imported cases and a low growth rate at the early stage of the epidemic, but they experienced significant growth in imported cases during the middle stage of the epidemic, indicating these cities had higher diffusion risks during this middle stage. Other cities had few imported cases during the early stage of the epidemic and did not experience rapid growth during the entire epidemic, mainly because they had lower diffusion risk coefficients.
Based on the daily diffusion risk of cities in Guangdong, the cumulative risk of these cities is calculated (Figures 8 and 9). The analysis of the simulated diffusion risk coefficient indicates that, in theory, Guangdong has passed the turning point of the COVID-19 epidemic. On January 29, 2020, the cumulative diffusion risks of the cities reached the theoretical turning point. The cumulative diffusion risks were mainly concentrated in the Pearl River Delta metropolitan area, especially in the cities of Shenzhen, Guangzhou, Dongguan, Foshan, Zhuhai, and Huizhou. However, given the high concentration of industrial firms in the Pearl River Delta region, there is still a risk that, after the economy is reopened, the migratory workers from Hubei will bring a second wave of diffusion risk, especially in the cities where a higher diffusion risk existed early in the epidemic.
Figure 8.
Cumulative diffusion risk (<italic>Risk<sub>diffusion</sub></italic>) status in cities across Guangdong
Population mobility, especially population inflows from epidemic areas, has been the main source of the spread of the COVID-19 epidemic. This paper focuses on the epidemic risk posed by Guangdong’s migratory population, utilizes big data on population migration, and applies the geospatial analysis technique to develop a model to perform spatiotemporal analyses of COVID-19 risk. The model takes into consideration the risk differential between the source cities of population migration, as well as the heterogeneity in the socioeconomic characteristics of the destination cities. It further incorporates a time-lag process based on the time period of imported COVID-19 cases. In theory, the model will be able to predict the trend of the evolution and spatial distribution of COVID-19 risk for a certain time period in the future, as well as provide support for advanced planning and targeted prevention.
The results of the simulated imported risks and diffusion risks indicate that the COVID- 19 epidemic in Guangdong passed the turning point on January 29, 2020 and entered a stable stage. Based on the probability distribution of the lag period of imported COVID-19 cases, the common practice of 14-day isolation of migratory populations adopted across China is effective for most confirmed cases or virus carriers. The lag period for a few cases or virus carriers is more than 14 days, so consideration should be given to extending the isolation period. The simulated results for the imported risk and diffusion risk indicate that there is significant spatiotemporal heterogeneity in the COVID-19 epidemic risk in Guangdong; the risk varies considerably between cities depending on the imported risk, susceptibility risk, and prevention risk. Shenzhen and Guangzhou are the high-risk regions; other cities in the Pearl River Delta, including Dongguan, Foshan, Huizhou, Zhuhai, and Zhongshan, have medium risks; and the cities in eastern, western, and northern ports of Guangdong that are outside of the Pearl River Delta have low risks.
4.2 Discussion
With a new infectious disease, it usually takes a long time for specific vaccines and medical treatment that fundamentally cure the disease to be developed. At this time, direct and effective emergency prevention and control measures are still isolation prevention and control strategies based on population flow restriction. Tian et al. found that, during the first 50 days of the COVID-19 epidemic in China, the measures adopted by Wuhan and other provinces and direct-administered municipalities to restrict population mobility broke the spread of the epidemic across China to a certain extent and prevented over 700,000 cases that otherwise would have occurred. The shutdown of Wuhan reduced the time during which the epidemic would have spread to other cities by 2.91 days (Tian et al., 2020). Although the measures to prevent imported cases and diffusion within the area have achieved clear results, it is still important to fully understand the mechanism through which COVID-19 spreads as well as the complex factors that affect its spread. With the reopening of the economy, people will move around more frequently, and the methods of preventing importation and diffusion of the virus within the area will face tremendous challenges. The COVID-19 spread will shift from being family gathering-based to workplace-based, and difficulties in preventing the disease will increase. For these reasons, there is a need to strengthen the measures of isolating workers from Hubei or other areas with a high COVID-19 risk.
The negative impacts of restricting population mobility on productivity, peoples’ daily lives, and the economy should not be ignored. Therefore, it is imperative to effectively grasp the spatiotemporal pattern of the spread and implement hierarchical prevention measures based on the spatial heterogeneity of the risk so as to achieve localized, targeted prevention and ensure the smooth operation of society. Currently, the most commonly employed model for COVID-19 risk is the susceptible-exposed-infectious-recovered model. Its main idea is to divide the population into the suspected high-risk population, the exposed population, the infected population, and the recovered population and identify the pattern of spread by examining the mechanism through which the disease is transmitted from one group to another. It has a high requirement for its parameters. This paper only considers the exposed population and infected population, which is a limitation of the paper: On one hand, this decision was due to the insufficiency of available data; on the other, the goal that guided this research was to realize spatial division of the COVID-19 risk and differentiated adoption of prevention levels, and this is why the paper focuses on infected population, an important indicator for evaluating the epidemic situation.
Further, this study incorporates the accurate incidence rates of the cities in Hubei, the lag period of the imported cases, the risk differential between source regions for population migration, and the variance in the socioeconomic situations of the destination regions, to make up for the above-mentioned deficiency in epidemic risk analysis. In addition, this paper does not consider the potential impact of undocumented infected cases. The existence of a large number of such asymptomatic virus carriers who can be super spreaders may cause rapid spread of the COVID-19 virus (Li et al., 2020b). Knowing more about the undocumented cases is vital to fully understanding the overall incidence rate of COVID-19. This requires fundamental improvement of the COVID-19 testing methods and expansion of the testing scope to asymptomatic patients.
In summary, amid a major public health emergency such as COVID-19, emergency management and control usually incorporate expertise from multiple disciplines, such as pathology, epidemiology, geoinformatics, psychology, and behavioral sciences. This paper integrates epidemiology and geoinformatics and performs some seminal work in modeling the spatiotemporal distribution of COVID-19 epidemic risk. Limited by data availability, however, the analysis is only performed on prefecture-level cities. In fact, with the internet and the almost 100% coverage of cell phone signaling, it is completely possible, through geoinformation techniques, to accurately mine the data of key activity trajectories and activity hotspots of key groups of people and set the level of prevention measures on the inflow population using communities, enterprises, and institutions as the unit. This would alleviate the socioeconomic losses due to excessive prevention and control measures. Therefore, in the future, while ensuring that privacy is strictly protected and confidentiality protocols are followed, it is worthwhile to explore methods and systems for targeted prevention and control by making full use of large spatial data such as cell phone signals and improving the detection level of asymptomatic cases.
At present, the epidemic situation of COVID-19 has shown a global trend. An approach that integrates elements of coordination, classification, and collaboration Zhao et al., 2020) and scientific support from the GIS and big data technologies (Zhou et al., 2020a) helped China earn tremendous successes in fighting COVID-19. These strategies as well as locally implemented best practices in China are worth adopting globally.
[11] GengMengjie, KamranKHAN, RenXiang et al. Assessing the risk of MERS importation from South Korea into cities of China: A retrospective study. Chinese Science Bulletin, 61, 1016-1024(2016).
[26] ZhouChenghu, PeiTao, DuYuyan et al. Big data analysis on COVID-19 epidemic and suggestions on regional prevention and control policy. Bulletin of Chinese Academy of Sciences, 35, 200-203(2020).
Yuyao YE, Changjian WANG, Hong’ou ZHANG, Ji YANG, Zhengqian LIU, Kangmin WU, Yingbin DENG. Spatiotemporal analysis of COVID-19 risk in Guangdong Province based on population migration[J]. Journal of Geographical Sciences, 2020, 30(12): 1985