Author Affiliations
1School of Economics, Yunnan University of Finance and Economics, Kunming 650221, China2Institute of Land & Resources and Sustainable Development, Yunnan University of Finance and Economics, Kunming 650221, China3Institute of Targeted Poverty Alleviation and Development, Yunnan University of Finance and Economics, Kunming 650221, Chinashow less
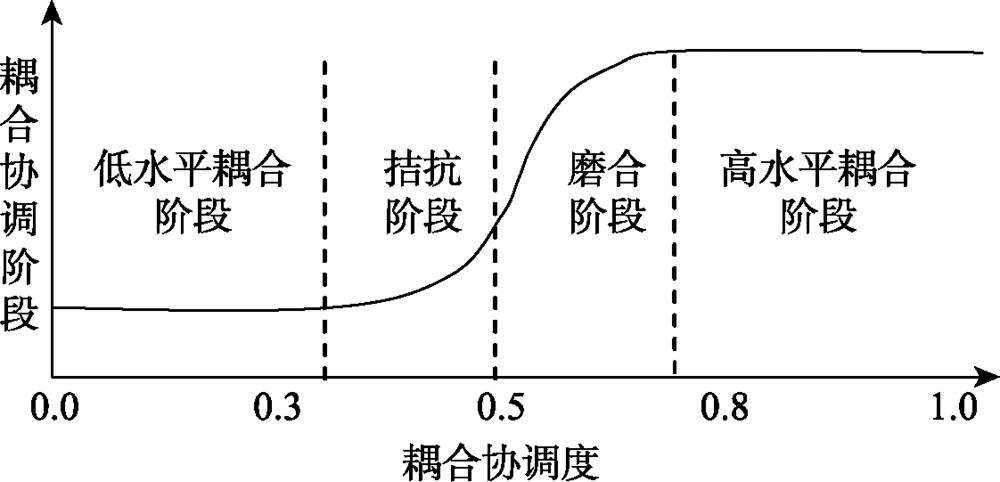
Fig. 1. Coupling process of urban-rural coordinated development and rural poverty governance
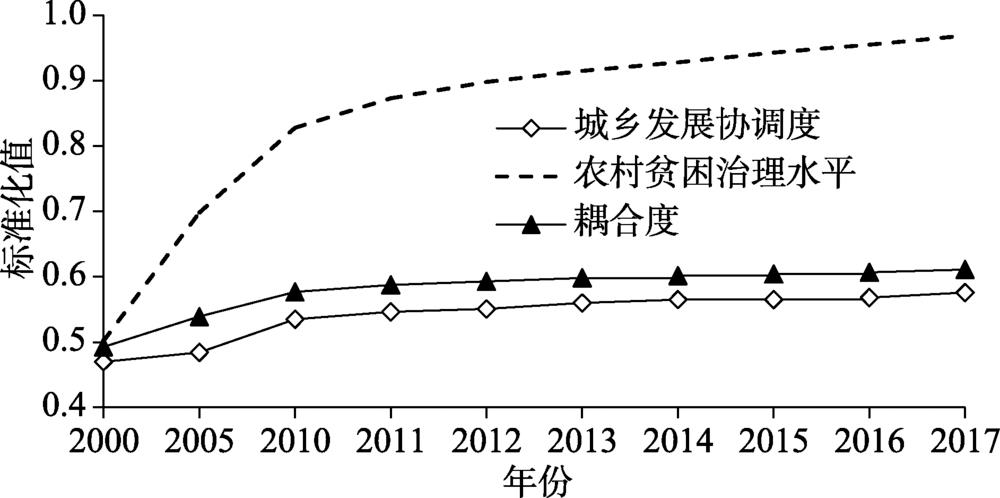
Fig. 2. Coupling trend of urban-rural coordinated development and rural poverty governance in China, 2000-2017
Fig. 3. Provincial coupling coordination degree of urban-rural coordinated development and rural poverty governance in China, 2010-2017
Fig. 4. Spatial distribution of change’s classification of coupling coordination degree of urban-rural coordinated development and rural poverty governance in China, 2010-2017
| 维度 | 一级指标 | 平均权重 | 主成分权重 | 综合权重 | 城镇指标 | 乡村指标 |
|---|
| 生活 | 收入协调度Z1 | 0.1 | 0.1809 | 0.1405 | 城镇居民人均可支配收入X1 | 农村居民人均纯收入Y1 | | 消费协调度Z2 | 0.1 | 0.0846 | 0.0923 | 城镇居民人均消费X2 | 农村居民人均消费Y2 | | 经济 | 经济发展协调度Z3 | 0.1 | 0.0761 | 0.0881 | 人均非农业产值X3 | 人均农业产值Y3 | | 资本投入协调度Z4 | 0.1 | 0.0179 | 0.0590 | 城镇人均固定资本投资X4 | 农村人均固定资本投资Y4 | | 市场发展协调度Z5 | 0.1 | 0.0630 | 0.0815 | 城镇人均消费品零售额X5 | 乡村人均消费品零售额Y5 | | 社会 | 就业水平协调度Z6 | 0.1 | 0.0528 | 0.0764 | 城镇就业人口比例X6 | 农村就业人口比例Y6 | | 教育水平协调度Z7 | 0.1 | 0.1648 | 0.1324 | 城镇人口平均受教育年限X7 | 农村人口平均受教育年限Y7 | | 医疗水平协调度Z8 | 0.1 | 0.1290 | 0.1145 | 城镇每千人医疗机构床位数X8 | 乡村每千人医疗机构床位数Y8 | | 资源环境 | 资源分配协调度Z9 | 0.1 | 0.0950 | 0.0975 | 城镇人均日用水量X9 | 乡村人均日用水量Y9 | | | | | | 城镇人均建设用地面积X10 | 乡村人均建设用地面积Y10 | | 环境治理协调度Z10 | 0.1 | 0.1359 | 0.1180 | 城镇生活垃圾无害化处理率X11 | 乡村卫生厕所普及率Y11 |
|
Table 1. Index system of urban-rural coordination
| 耦合协调度 | 耦合协调阶段 | 耦合内涵 |
|---|
| 0.0<D≤0.3 | 低水平耦合阶段 | 城乡差距较小,城乡发展协调性较好,农村贫困水平较低,城乡发展差距对农村贫困的影响不大,农村内部基本能够包容城乡二元经济所带来的贫富差距 | | 0.3<D≤0.5 | 拮抗阶段 | 城乡发展协调水平已超越其发展拐点,城乡发展协调性被打破,农村贫困开始加剧 | | 0.5<D≤0.8 | 磨合阶段 | 城乡发展协调水平开始转型升级,此时开始关注农村发展,将更多资源注入农村,农村贫困逐步缓解。城乡协调发展与农村贫困治理之间开始形成良性互动 | | 0.8<D≤1.0 | 高水平耦合阶段 | 城、乡均达到高质量发展水平,乡村全面振兴,基本实现城乡融合与城乡一体化,农村贫困基本消失 |
|
Table 2. Division of development stages of coupling coordination degree
| 年份 | 2000 | 2005 | 2010 | 2011 | 2012 | 2013 | 2014 | 2015 | 2016 | 2017 |
|---|
| 城乡发展协调度 | 0.4700 | 0.4843 | 0.5350 | 0.5464 | 0.5509 | 0.5600 | 0.5650 | 0.5652 | 0.5682 | 0.5758 | | 农村贫困治理水平 | 0.5020 | 0.6980 | 0.8280 | 0.8730 | 0.8980 | 0.9150 | 0.9280 | 0.9230 | 0.9550 | 0.9690 | | 耦合协调度 | 0.4928 | 0.5392 | 0.5769 | 0.5877 | 0.5930 | 0.5982 | 0.6017 | 0.6042 | 0.6069 | 0.6111 |
|
Table 3. Coupling coordination degree of urban-rural coordinated development and rural poverty governance in China, 2000-2017
| 地区 | 省份 | 2010年 | | 2013年 | | 2017年 | 2010—2017年耦合协调度增幅/% |
|---|
| 城乡发展协调度 | 农村贫困治理水平 | 耦合协调度 | 城乡发展协调度 | 农村贫困治理水平 | 耦合协调度 | 城乡发展协调度 | 农村贫困治理水平 | 耦合协调度 |
|---|
| 东部 | 河北 | 0.5032 | 0.8420 | 0.5705 | | 0.5143 | 0.9350 | 0.5888 | | 0.6007 | 0.9780 | 0.6191 | 8.51 | | 山东 | 0.5106 | 0.9240 | 0.5860 | 0.5561 | 0.9630 | 0.6049 | 0.5057 | 0.9920 | 0.5951 | 1.55 | | 江苏 | 0.5399 | 0.9620 | 0.6003 | 0.5536 | 0.9800 | 0.6069 | 0.5671 | 1.0000 | 0.6136 | 2.22 | | 浙江 | 0.5288 | 0.9610 | 0.5970 | 0.5188 | 0.9810 | 0.5972 | 0.5585 | 1.0000 | 0.6113 | 2.39 | | 福建 | 0.4649 | 0.9380 | 0.5746 | 0.4850 | 0.9740 | 0.5862 | 0.5180 | 1.0000 | 0.5999 | 4.40 | | 广东 | 0.4406 | 0.9540 | 0.5693 | 0.4837 | 0.9830 | 0.5872 | 0.4967 | 1.0000 | 0.5936 | 4.27 | | 海南 | 0.4861 | 0.7620 | 0.5516 | 0.4858 | 0.8970 | 0.5745 | 0.4909 | 0.9610 | 0.5860 | 6.23 | | 东北 | 辽宁 | 0.4652 | 0.9090 | 0.5702 | | 0.5470 | 0.9460 | 0.5997 | | 0.5034 | 0.9830 | 0.5931 | 4.01 | | 吉林 | 0.4115 | 0.8530 | 0.5443 | 0.4349 | 0.9410 | 0.5656 | 0.4780 | 0.9730 | 0.5839 | 7.29 | | 黑龙江 | 0.5020 | 0.8730 | 0.5753 | 0.5704 | 0.9410 | 0.6052 | 0.5217 | 0.9730 | 0.5969 | 3.75 | | 中部 | 山西 | 0.4770 | 0.7590 | 0.5485 | | 0.5358 | 0.8760 | 0.5853 | | 0.5381 | 0.9450 | 0.5971 | 8.86 | | 安徽 | 0.4780 | 0.8430 | 0.5634 | 0.4882 | 0.9180 | 0.5786 | 0.5205 | 0.9700 | 0.5961 | 5.80 | | 江西 | 0.4118 | 0.8420 | 0.5426 | 0.4945 | 0.9080 | 0.5788 | 0.4916 | 0.9700 | 0.5876 | 8.29 | | 河南 | 0.4521 | 0.8190 | 0.5516 | 0.4929 | 0.9210 | 0.5804 | 0.4893 | 0.9660 | 0.5863 | 6.30 | | 湖北 | 0.4147 | 0.8310 | 0.5418 | 0.5525 | 0.9200 | 0.5970 | 0.5488 | 0.9720 | 0.6043 | 11.54 | | 湖南 | 0.4234 | 0.8210 | 0.5429 | 0.4405 | 0.8880 | 0.5592 | 0.4752 | 0.9590 | 0.5810 | 7.01 | | 西部 | 内蒙古 | 0.4005 | 0.8030 | 0.5325 | | 0.4340 | 0.9150 | 0.5613 | | 0.4490 | 0.9730 | 0.5749 | 7.96 | | 广西 | 0.4942 | 0.7570 | 0.5530 | 0.5502 | 0.8510 | 0.5849 | 0.5662 | 0.9430 | 0.6044 | 9.30 | | 重庆 | 0.4078 | 0.8490 | 0.5424 | 0.4650 | 0.9400 | 0.5749 | 0.4690 | 0.9910 | 0.5838 | 7.64 | | 四川 | 0.5015 | 0.7980 | 0.5624 | 0.5423 | 0.9140 | 0.5933 | 0.5852 | 0.9690 | 0.6136 | 9.10 | | 贵州 | 0.3610 | 0.5490 | 0.4718 | 0.4022 | 0.7870 | 0.5304 | 0.4474 | 0.9150 | 0.5656 | 19.88 | | 云南 | 0.5036 | 0.6000 | 0.5243 | 0.5055 | 0.8220 | 0.5677 | 0.5447 | 0.9250 | 0.5958 | 13.64 | | 陕西 | 0.4027 | 0.7270 | 0.5201 | 0.4499 | 0.8490 | 0.5559 | 0.4294 | 0.9370 | 0.5632 | 8.28 | | 甘肃 | 0.4727 | 0.5870 | 0.5132 | 0.4863 | 0.7620 | 0.5517 | 0.5599 | 0.9030 | 0.5963 | 16.19 | | 青海 | 0.4285 | 0.6850 | 0.5205 | 0.3635 | 0.8360 | 0.5250 | 0.3749 | 0.9400 | 0.5448 | 4.67 | | 宁夏 | 0.4299 | 0.8170 | 0.5444 | 0.4498 | 0.8750 | 0.5601 | 0.4547 | 0.9550 | 0.5740 | 5.45 | | 新疆 | 0.4990 | 0.5540 | 0.5127 | 0.4700 | 0.8020 | 0.5541 | 0.4018 | 0.9010 | 0.5485 | 6.97 |
|
Table 4. Provincial coupling coordination degree of urban-rural coordinated development and rural poverty governance in China, 2010-2017
| 耦合协调度变化分级 | 耦合协调度增幅范围/% | 包括的省份 |
|---|
| 高幅增长 | [13.64, 19.88] | 贵州、云南、甘肃 | | 中高幅增长 | [8.29, 11.54] | 河北、山西、江西、湖北、广西、四川、陕西 | | 中幅增长 | [4.67, 7.96] | 海南、吉林、安徽、河南、湖南、内蒙古、重庆、宁夏、青海、新疆 | | 低幅增长 | [1.55, 4.40] | 山东、江苏、浙江、福建、广东、辽宁、黑龙江、 |
|
Table 5. Change grading of coupling coordination degree of urban-rural coordinated development and rural poverty governance in China, 2010-2017