
Olivier Peyrusse. On the possibility of ultrafast Kossel diffraction[J]. Matter and Radiation at Extremes, 2022, 7(4): 044402
- Matter and Radiation at Extremes
- Vol. 7, Issue 4, 044402 (2022)
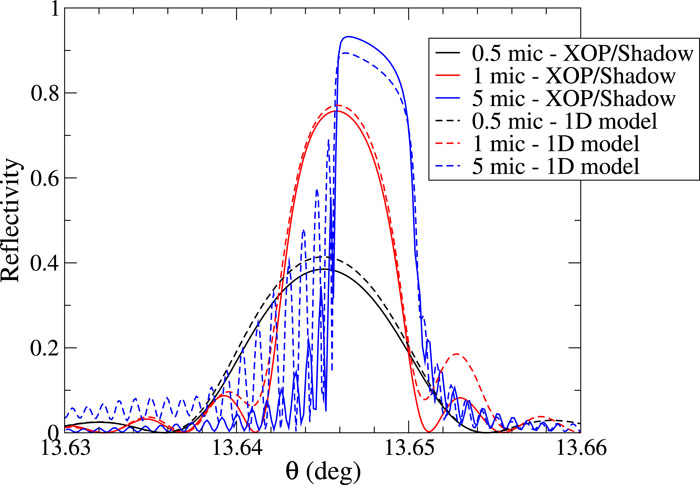
Fig. 1. Rocking curve of Ge 111 samples of different thicknesses around the Bragg angles at 8047.8 eV. Full curves correspond to calculations based on the standard methods of the XOP package32,33 and dashed curves to the present 1D model as discussed in the text.
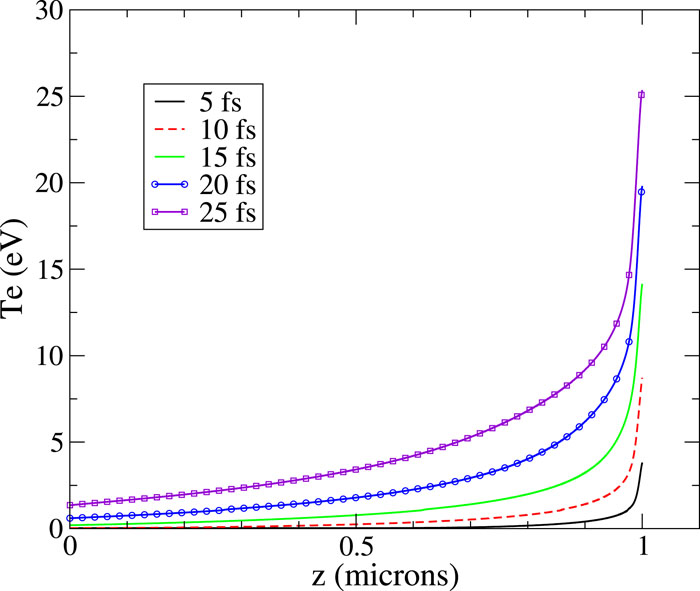
Fig. 2. Snapshots at different times of the thermal-electron temperature in a 1 µ m thick Ni foil. The hot-electron beam comes from the right. The parameters of the simulation are given in the text.
Fig. 3. Snapshots at different times of the Kα 1 emission from a Ni sample as a function of the observation angle. The parameters of the simulation correspond to Fig. 2 .
Fig. 4. Snapshots at different times of the Kα 1 emission from a Ni sample as a function of the observation angle. The parameters of the simulation are given in the text. The inset is a zoom of the emission at the time of maximum emission. The dashed line is the broadened profile when the FWHM energy broadening of the Kα 1 line is taken into account.
Fig. 5. Kossel patterns of the Kα emission from a 100 nm thick Ni sample at different times. The irradiation parameters of the simulation are those of Fig. 3 .
Fig. 6. Snapshots at different times of the Kα 1 emission from a Mo sample as a function of the observation angle. The parameters of the simulation are given in the text. The inset is a zoom of the emission at the time of maximum emission. The dashed line is the broadened profile when the FWHM energy broadening of the Kα 1 line is taken into account.
Fig. 7. Snapshots at different times of the Mg Kα emission from a 1 µ m thick multilayer (Mg/Co)125 as a function of the observation angle. The parameters of the simulation are given in the text. Kossel patterns are labeled by their Bragg order.
Fig. 8. Snapshots at different times during a phonon oscillation, of the Kα emission from a 400 nm thick Ni sample as a function of the observation angle around the Bragg angle. The parameters of the simulation are given in the text.
Fig. 9. Geometry of a possible experimental setup for pump–probe Kossel diffraction experiments.
Fig. 10. Another possible experimental setup for pump–probe transmission Kossel diffraction experiments.


Set citation alerts for the article
Please enter your email address

© Copyright 2018-2021 | Chinese Laser Press. All Rights Reserved 沪ICP备15018463号-20