
Olivier Peyrusse. On the possibility of ultrafast Kossel diffraction[J]. Matter and Radiation at Extremes, 2022, 7(4): 044402
- Matter and Radiation at Extremes
- Vol. 7, Issue 4, 044402 (2022)
Abstract
I. INTRODUCTION
Very soon after their discovery, x-rays were used for obtaining structural information on solid-density matter. In particular, x-ray crystallography became a well-established tool for measuring time-averaged positions of atoms in periodic systems. More recently, x-ray-based investigations have focused on phase-transition dynamics using diffraction (for a review, see Ref. 1) and time-resolved x-ray absorption near-edge spectroscopy (for a review, see Ref. 2). What is sought in this context is a measurement of the change in the spatial arrangement of atoms on the pathway leading to a structural change. Typically, the timescale of interest is between 10−14 and 10−12 s. For these studies, a natural approach is femtosecond x-ray crystallography.3–8 A first requirement for this approach is a source of femtosecond x-ray pulses. Among these sources, Kα emission driven by table-top, short, intense, and high-repetition-rate laser sources has proven to be convenient (see Refs. 9 and 10 and references therein). These x-ray Kα emission sources result from inner-shell ionization by the hot electrons generated by the interaction of short, ultra-intense laser pulses with solid matter. Then, one exploits these short Kα x-ray bursts for probing matter (using x-ray diffraction) in pump–probe experiments where an external pump (most often another pulse of low intensity but from the same laser chain to avoid any uncontrolled jitter) drives macroscopic excitation of the sample. In this context, these sources have been shown to be efficient in experiments requiring 100 fs time resolution.11 Such studies have not paid further attention to the possible specificities of K-shell emission, rather considering it to be just a way to obtain x-ray photons to be diffracted by a sample. Here, we should remark that, in itself, K-shell emission spectroscopy may be a useful structural tool. For instance, Kβ spectroscopy gives information on 3d transition metal systems12 (although indirectly through the interaction between 3p holes and 3d electrons). We note here that observing changes in the spectral features of Kα, β lines due to the chemical environment requires high spectral resolution (λ/Δλ ≥ 5000). Another appropriate remark is that if x-ray emission takes place inside a crystal, outgoing emission is strongly enhanced in directions located on the surface of a cone of semi-angle π/2 − θB (θB being the Bragg angle) and of axis normal to the hkℓ planes of the crystal. This angular distribution of x-ray emission is known as Kossel diffraction13 or an x-ray standing wave at reverse.14 In the vicinity of these cones, the intensity variation leads to characteristic Kossel angular profiles. It is known that, in contrast to traditional x-ray diffraction, these profiles also contain information on the phase,15–17 which is a unique aspect of Kossel diffraction. In itself, this unique aspect justifies a careful analysis of the possibility of using Kossel diffraction for the study of rapidly evolving dense matter samples. This may have an impact on studies of extreme states of matter. It should, however, be noted that a quantitative analysis of Kossel line profiles is a very involved task and that, before this is attempted, one has to discuss the possibility of observing and measuring these profiles under transient conditions, which is the goal of this article.
On the basis of these considerations, the concept developed in this paper is that of directly using the information brought by Kα emission arising in a periodic structure as it results from the burst of hot electrons produced by the interaction of a short, high-intensity laser pulse with matter. In other words, the idea is to use the hot-electron flux arising from a target submitted to a high-contrast, high-intensity, ultrashort laser and then analyze the spatial structure of Kα emission arising from a prepared sample submitted to this electron flux. This approach is of interest because it could provide greater access to in-depth structural modifications compared with what is available from x-ray diffraction based on reflectivity measurements. This raises the question of the material heating by the hot-electron flux itself. This heating results, in a first step, from collisional thermalization of these hot electrons and, in a second step, from the coupling of the thermal electron bath with the lattice. The impact of this coupling in terms of structural modifications is felt typically after 1 ps, and so the duration of the hot-electron burst (inducing the Kα burst) must be much smaller than 1 ps, i.e., typically a few tens of femtoseconds. The duration of this burst (the probe) also gives the time resolution that can be expected to be achieved in experiments where some information is sought concerning the structural dynamics of a material heated by some external means (the pump). We remark here that the increase in thermal-electron temperature due to hot-electron energy deposition is not an issue in pump–probe experiments where a submicrometer sample is refreshed after each shot. In other word, whatever its intrinsic perturbation, the hot-electron burst (starting at t) remains a probe of about 100 fs duration at maximum (this includes pulse duration, propagation, and Kα emission) in a thin material previously prepared by the pump (at t − Δt, where Δt is a variable delay). As explained below, Kossel diffraction lines provide a signature of a layered structure, whether it is natural (crystalline) or artificial (a stack of nanometer-thick layers of different materials). We discuss here some specificities of the fluorescence emission from such media, as resulting from inner-shell excitation by a short burst of hot electrons. In the case of crystals, and at the wavelength of the fluorescence lines, an appropriate angular scan around the Bragg angle should give a clear indication of the crystalline order. As said above, if the medium is heated by some means in a controlled manner (pump–probe experiments), the disappearance of the Kossel structures is a clear indication of a loss of crystalline order. By using different delays between the pump and the short burst of electrons, this loss of crystalline order could be followed in time. Below the melting temperature (low-fluence pump excitation), there is also the possibility of studying the modification of Kossel patterns as a function of time (to follow strain propagation, for instance). In this article, we also discuss the possibility of detecting Kossel structures from artificial multilayers or detecting specific phonons resulting from a specific excitation in solids. Again, we note that since the inner-shell ionization can be provided in depth, this analysis might be applied to specific samples embedded in another material. Finally, many conclusions in this article apply also to the case where the ionization source is a short and intense photon source such an x-ray free-electron laser (XFEL) where (inner-shell) collisional ionization is replaced by photoionization.
To complete this introduction, it is important to note that Kossel diffraction is just one aspect among other specificities of “inside” sources emission. Indeed, considering individual atoms in a large periodic structure, the intensity of radiation coming from one particular atom can be formally written in the first Born approximation as18,19
II. KOSSEL DIFFRACTION IN LAYERED MEDIA IRRADIATED BY HOT ELECTRONS
So-called Kossel diffraction corresponds to x-ray interference from lattice sources. Such interference causes modulation of the x-ray line intensity as a function of the exit angle. This phenomenon was predicted by Kossel24 and then first observed13 from the fluorescence following electron excitation of a copper single crystal. In addition to electrons, this excitation can be accomplished by protons or x-rays, each atom in the lattice becoming the origin of a spherical wave interfering with others. Modulation of the outgoing fluorescence intensity arises in a narrow angular range around θB satisfying the Bragg condition dsample sin θB = nλsample/2. dsample is the interreticular distance in the crystal and λsample is the wavelength of the fluorescence line (typically a Kα line). It can be seen that λsample must be smaller than 2dsample, and so not all the crystals can display Kossel lines. This is the case for Mg, Al, and Si, for instance. As mentioned above, another consequence is that x-ray emission is distributed on the surface of a cone of semi-angle π/2 − θB and on an axis normal to each reticular plane hkℓ.14
Kossel diffraction has a number applications. Among these, we note in particular lattice constant determination, crystal orientation, residual stress measurements in the micro-range, and observation of phase transformations in the high- or low-temperature range (see Ref. 25 and references therein). In artificial multilayer materials (stack of nanometer-size layers of different materials) dedicated to x-ray optics, Kossel patterns in the x-ray fluorescence following photon26 and electron27,28 excitation have also been observed and interpreted (for a review, see Ref. 29). In these studies, the goal was to obtain information on interfacial roughness and interdiffusion from Kossel line features. Still, for layered media, recent calculations of these patterns have focused on the case of strong photon excitation such as that provided by XFEL irradiation.30 In this article, we will consider only multilayers defined as a stack of bilayers and denoted by
A. Modeling of the physical processes
1. Fluorescence emission
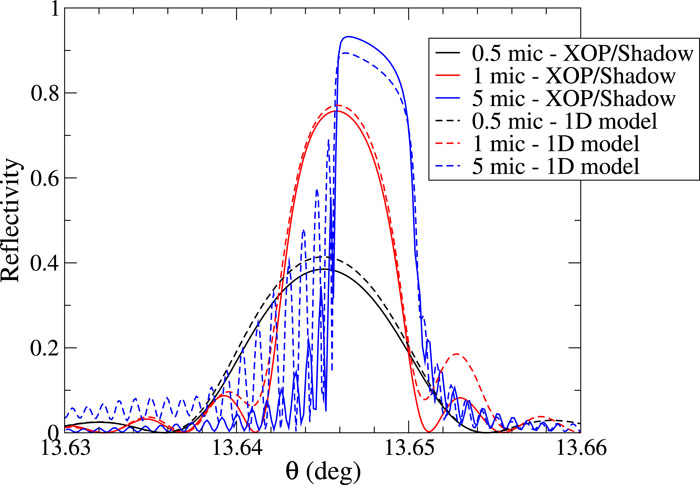
For calculating the Bragg diffraction of the fluorescence emission inside a 1D multilayer, we use the model described in Ref. 19, the only difference being in the ionization, which is provided here by a short burst of hot electrons instead of photons. The slowing down of these electrons provides an in-depth distribution of ionization that is not homogeneous. Modeling of this distribution relies on a model of hot-electron transport to be described in Sec. II A 2. For a crystal, we consider a simple picture where the 3D lattice is replaced by a layered lattice. The material is assumed to be distributed uniformly in lattice planes parallel to the surface. In other words, the crystal is approximated by a stack of bilayers of period d (the reticular distance between two planes), where the first layer is the layer of atoms while the second layer is an empty layer of refractive index 1. Although this is a rough method to simulate the problem of the distribution of individual small scatterers, the replacement of real atoms by a uniform layer of a given thickness e1 has a semi-empirical validity. A relevant quantity to measure its effectiveness is the reflectivity, which for a wavelength of interest can be calculated around the Bragg angle and compared with a model giving the reflectivity of a real crystal. Such models are based on dynamical x-ray diffraction theory (for a recent review of modern implementations, see, e.g., Ref. 31). As in Ref. 30, calculations of the electric field in this article are based on a solution of the Helmholtz equation applied to materials defined as juxtapositions of media of different indices. The x-ray reflectivity of a crystal can then be obtained from a solution of the 1D Helmholtz equation applied to the stack (element/vacuum)N. We compared such reflectivities with results from the XOP-SHADOW package,32,33 allowing a calculation of the reflectivity in real crystals. We found that, taking for the element thickness a typical value of e1 = 0.4d (d being the proper interreticular distance in the crystal of interest) and with appropriate renormalization of the number of atoms in this element layer to the right number of atoms (per volume unit), this approach gives results close to those from more realistic crystal models. As an example, Fig. 1 displays the rocking curve of a Ge 111 sample for three different thicknesses, around the Bragg angle and for an incident photon energy corresponding to the Cu Kα line (8047.8 eV). A comparison is made between our approach and results from the XOP-SHADOW package.32,33 The match is not perfect, but it can be seen that our simplified 1D approach gives satisfactory results for the width and the shape of the diffraction pattern. With regard to what follows, the interest of our approach is that it allows a comprehensive modeling of both the fluorescence and the hot-electron transport in a layered medium, of which a crystal is an example.
![]()
Figure 1.Rocking curve of Ge 111 samples of different thicknesses around the Bragg angles at 8047.8 eV. Full curves correspond to calculations based on the standard methods of the XOP package
As in Ref. 30, the fluorescent field E(z, θ) at each point of the multilayer and arising on the detector is calculated by solving the Helmholtz wave equation and by invoking the reciprocity theorem,34,35 i.e., by considering a fictitious source located at infinity and emitting at the fluorescence line wavelength. The fluorescence intensity at an infinite distance from the sample and as a function of the exit angle θ is then I = ∫j(z)|E(z, θ)|2dz, where j(z) is the fluorescence emissivity induced locally by inner-shell ionization. j(z) is proportional to the upper-level population of the fluorescent transition and to the corresponding Einstein coefficient. A basic ingredient for the Helmholtz wave equation is the local complex refractive index, whose real and imaginary parts depend on the distribution of atomic populations in the multilayer (see Ref. 30 for more details). Here, this distribution is linked to the local distribution of the free electrons (thermal and hot electrons) driving the ionization.
2. K-shell ionization and fast electron transport
For calculating the fast electron transport, we use a 1D deterministic model developed for calculating the transport of high-energy photoelectrons as produced in the interaction of multi-keV photons with matter.36 The right-hand terms in the standard transport equation for the angular fluence of hot electrons (denoted by W) are a source term Q and a collision operator C(W) accounting for slowing down and scattering in other directions (see Ref. 36 for more details). This collision operator is written in the Fokker–Planck approximation.37 It is important to note that the model is 1D in the sense that it applies to the propagation of electrons in a medium stratified in parallel planes perpendicular to the z axis. According to the position on this axis, different discretized propagation directions μi = cos θi are considered so that each electron (or rather each group of electrons) may be scattered locally in a different direction at each time step. Therefore, both the local fluence W and the source term Q depend on the four quantities E, z, t, μ, and so Q(E, z, t, μ) is the number of hot electrons of energy E produced per interval of energy ΔE, at position z, at time t, and in direction of travel μ. For simplicity, this source is put on one side of the medium (the outermost cell) and is assumed to follow the laser deposition of energy on hot electrons, and so Q has the form
Finally, it is important to keep in mind that validity of this 1D approach is a priori restricted to situations where the sample thickness is smaller than the size of the focal spot. Results are just informative in the opposite case.
III. SIMULATION RESULTS
A. Hot-electron energy deposition in a Ni crystal: Kα fluorescence
An example of a simulation of hot-electron energy deposition (as a consequence of hot-electron transport) in a 1 µm thick Ni sample is displayed in Fig. 2. Here the laser pulse is of 20 fs duration and of intensity 1.3 × 10¹⁸ W/cm2 at wavelength 800 nm. According to Yu’s law,42 the conversion efficiency into hot electrons is η = 0.046. Under these conditions, the typical energy of these hot electrons is kTh = 50 keV. The spatial profiles of the thermal-electron temperature at different instants during the pulse are plotted in Fig. 2. Note that the hot-electron beam comes from the right. This thermal-electron temperature is assumed to transfer to the lattice, but on a timescale much longer than the hot-electron pulse duration. Then, over its own time duration, the structural information carried by the Kα emission is not impacted by this hot-electron heating in a single-shot mode. The Ni Kα1 emission (7478.15 eV) resulting from the inner-shell ionization by hot electrons is displayed in Fig. 3 at different times during the pulse. More precisely, what is shown in Fig. 3 is an angular scan of the Kα1 emission on the front side of the sample (i.e., the right side), θ being the observation angle relative to the surface of the sample. In these calculations, the (111) planes of Ni are assumed to be parallel to the surface so that our 1 µm thick Ni crystal is approximated by a stack of 4630 bilayers of period d = 0.216 nm, with the first layer (of thickness e1 = 0.4d, see Sec. II A 1) being a layer of Ni atoms, while the second layer is empty. Also, this emission corresponds here to the emission associated with all ionization stages compatible with the “cold” valence of Ni.
![]()
Figure 2.Snapshots at different times of the thermal-electron temperature in a 1
![]()
Figure 3.Snapshots at different times of the K
As discussed above, one observes a strong modulation of the outgoing emission around the Bragg angle θB = 22.6°. Note that for irradiation of the sample by hot electrons of higher energy and intensity, the result is not really different (except for the signal intensity). This is shown in Fig. 4, which corresponds to the fluorescence resulting from hot-electron excitation following interaction with a laser pulse of 20 fs duration but of intensity 1019 W/cm2. Here the conversion efficiency is η = 0.21 and the typical energy of hot electrons is kTh = 450 keV. The inset in the figure is a zoom of the Kossel structure at the time of maximum emission. Also shown is the final profile (dashed line) obtained by convolution with a Gaussian profile of width related to the angular broadening due to the energy width of the Kα line. Indeed, a simple differentiation of the Bragg relation gives Δθ = (ΔE/E)tan θ. From a reported FWHM measurement45 of the Ni Kα1 line (ΔE = 2.25 eV), we get Δθ = 7 × 10⁻³°. Note that after a few tens of femtoseconds, this intrinsic broadening in likely to be increased by the ionization, thus imposing a limit on the time during which the Kossel structure can be observed. In a way, this reinforces the ultrafast aspect of the Kossel signature under these conditions. There is also another contribution to the angular broadening that is purely geometric and due to the size of the emitting source. As discussed in Sec. IV, this contribution can be made negligible. The features shown in Figs. 3 and 4 are typical of the crystalline order of the material hosting the emission. These features are likely to fade away with ion temperature and to disappear when atomic displacements reach about 10% of the mean nearest-neighbor distance, i.e., when the crystal undergoes a solid-to-liquid phase transition (the Lindemann criterion). However, this behavior can hardly be studied with our 1D approach.
![]()
Figure 4.Snapshots at different times of the K
To finish this discussion of Ni Kα fluorescence, we present in Fig. 5, the Kα fluorescence around the Bragg angle for a thin film (100 nm) of Ni. The irradiation conditions correspond to Fig. 3, i.e., a Gaussian pulse of intensity 1.3 × 10¹⁸ W/cm2 and of duration 20 fs (wavelength 800 nm). Three snapshots of Kossel patterns around and at the peak of emission (23 fs) are shown. Here modulations are broader and of lower absolute intensity, since there are fewer emitting atoms. However, as we will see in Sec. IV, this level of intensity remains detectable.
![]()
Figure 5.Kossel patterns of the K
B. Hot-electron energy deposition and Kα fluorescence in a Mo crystal
Here we present calculations concerning another material, namely, molybdenum. The (111) planes of Mo are assumed to be parallel to the surface of a 1 µm thick sample. The crystal is then approximated by a stack of 5504 bilayers of period d = 0.1817 nm (the interreticular distance) where (for solving the Helmholtz equation) the first layer of thickness e1 = 0.4d (see Sec. II A 1) is a layer of Mo atoms, while the second layer is empty. The irradiation conditions correspond to Fig. 5, i.e., a Gaussian pulse of intensity 1019 W/cm2 and duration 20 fs. A few snapshots of the Kα1 (17 479.34 eV) angular emission are displayed in Fig. 6. The inset is a zoom of the Kossel structure around θB = 11.25°, at the peak of emission. Again, the dashed curve shows the final profile obtained by convolution with a Gaussian profile of angular width Δθ = 4 × 10⁻³° related to the energy width (ΔE = 6.38 eV) of the Mo Kα1 line.46
![]()
Figure 6.Snapshots at different times of the K
C. Kα fluorescence from a multilayer
Instead of a natural crystal, we consider here an artificial multilayer material in which fluorescence Kα emission is induced by hot-electron ionization. The material studied here is a stack of 125 bilayers (Mg/Co) of thicknesses e1 = 5.45 nm and e2 = 2.45 nm, respectively. The period is then d = 8 nm for a total thickness of 1 µm. We apply the methods discussed in Sec. II for calculating the Mg Kα fluorescence (1253.6 eV) as a function of the exit angle θ. The hot-electron source corresponds to a laser pulse of 20 fs duration and of intensity 1.3 × 10¹⁷ W/cm2 at wavelength 800 nm, and so the conversion efficiency into hot electrons is η = 0.008 and the typical energy of the hot electrons is kTh = 16 keV. Figure 7 displays a few snapshots of the angle-resolved Kα emission. One can observe the specific Kossel patterns for the different Bragg angles of the multilayer. Compared with a pure crystal, the modulations are broader. Note that such patterns are likely to be affected by the roughness of the interfaces. Introducing the roughness into the calculations and fitting the Kossel features is a way to characterize the quality of a multilayer.29
![]()
Figure 7.Snapshots at different times of the Mg K
D. Effect of vibrational dynamics on Kossel structures
It has been shown that the absorption of a near-infrared laser pulse with a duration of about 100 fs may provide coherent excitation of longitudinal phonons with large amplitude.4,7,8,47 Considering that this phonon excitation corresponds to coherent oscillations of atomic planes about their equilibrium positions, we model such oscillations in a 400 nm thick Ni film while it is submitted to a hot-electron beam providing inner-shell ionization. In our approach, this means that the displacement of each Ni layer k around its equilibrium position xk is ɛk = Ad cos(kxk − 2πν(k)t), where A is the amplitude of the displacement and d is the proper interreticular distance. k = ξπ/d is the phonon wave vector defined in terms of the reduced wave vectorξ, while the frequency ν(k) obeys a dispersion relation. From Ref. 48 and for a reduced wave vector of 1, the measured longitudinal phonon dispersion curve along the 111 direction of Ni (where d = 0.216 nm) gives a frequency ν = 9 × 10¹² Hz. Figure 8 displays typical snapshots of the angle-resolved Kα emission at different times during this particular oscillation, where the amplitude A has been set to 10%. Here we have assumed that our Ni film is homogeneously excited. In Fig. 8, one can observe how the phonon oscillation results in an oscillation of the Kossel structure. It should be noted that a heavier crystal material than Ni would exhibit smaller frequency oscillations. Such oscillations could more easily be probed by short bursts (a few tens of femtoseconds or less) of hot electrons. Likewise, the propagation of acoustic waves (superposition of longitudinal phonons in the sub-THz range) is likely to provide more pronounced oscillations of a Kossel structure around the Bragg angle than does a standard diffraction pattern.49
![]()
Figure 8.Snapshots at different times during a phonon oscillation, of the K
We note that nanostructures that consist of a stack of nanometer-thick crystalline layers as considered in Sec. III C, may also exhibit coherent vibrations, so-called super-lattice (SL) vibrations.8 These SL vibrations could also be probed by Kossel diffraction.
IV. ULTRAFAST STRUCTURAL DYNAMICS WITH A PUMP–PROBE APPROACH: TYPICAL EXPERIMENTAL CONFIGURATIONS
A presentation of the mechanisms exciting motion lattice in different materials is beyond the scope of this article (for a review, see Ref. 50) and likewise the generation of coherent plasmons at THz frequencies. Here we restrict ourselves to a few remarks concerning transient effects between electron and lattice temperatures in a metal or a semiconductor after excitation by an ultrashort laser (the so-called pump). There is indeed a great interest in understanding such an electron–ion dynamics interplay in this context. First, one has a fast deposition of the laser energy (pump) onto free electrons, which thermalize very quickly into a hot (quasi-Fermi) distribution. There then commences an energy transfer to the lattice via electron–phonon couplings. If this transfer (cooling) is fast compared with a phonon oscillation period, the resulting impulsive stress induces long-wavelength acoustic excitations (low-frequency phonons). The resulting strain waves (which can be regarded as a superposition of longitudinal acoustic phonons) are induced by a relaxation of the local pressure induced by the ion excitation and by the electron excitation itself. In x-ray diffraction measurements, this strain propagation into the lattice induces an oscillation of the diffraction signal around the Bragg angle.49 Thus, one can remark that there is no reason why a Kossel pattern would not have the same behavior as a standard diffraction one, i.e., exhibiting an oscillation around the Bragg angle. One of the issues that is actively studied by this means is the ultrafast heating and cooling of thin (between a few and a few tens of nanometers thick) metallic films, as long as the lattice temperature Ti remains less than the melting temperature Tm (see, e.g., Ref. 51). Because a strain can be converted into a change in the lattice temperature Ti, x-ray diffraction (and also Kossel diffraction) offers a way to study thermal transport in a layer stacking of different metals.
Another actively studied issue concerns the ultrafast transition from solid to liquid in metals. It is generally assumed that melting occurs when Ti exceeds Tm. Typically when Ti ≥ 1.4Tm, the lattice becomes disordered within a few vibrational periods. In this context of strong electron excitation by the pump (well before any probe), there are issues concerning the lattice dynamics, for which theoretical calculations predict different behaviors depending on the nature of the electronic density of states (DOS). Indeed, the strongly excited electron system can cause a strengthening (bond hardening) or a weakening (bond softening).52,53 Concerning hardening (i.e., an increase in Tm), this effect is predicted to occur if Te ≥ 3 eV in Cu and Te ≥ 6 eV in gold where one can expect a factor of three on Tm. It should be noted in passing that calculating the evolution of subsystems (electron and ions) requires parameters like the heat capacities Ce and Ci and the electron–ion coupling factor G. These parameters have to be calculated as functions of Te.54 Observing hardening (i.e., an increase in Tm) requires probing of lattice stability on a time shorter than the time of equilibration between excited electrons and the lattice. In this context, observation of the behavior of Kossel patterns at different delays from the pump pulse is likely to provide meaningful information.
A schematic experimental configuration for studying short Kossel patterns is shown in Fig. 9. At a time tL, a short and intense laser beam (of duration τL) interacting with a sample is used to produce a short burst of hot electrons. The bulk of the sample is then submitted to this hot-electron flux (roughly of duration τL). These electrons will ionize 1s electrons of the sample, which will result in a strong Kα emission to be analyzed. The structural state of the Kα-emitting zone can be varied by using another pulse (of much lower intensity but from the same laser chain) to provide controlled heating at a time tP earlier than tL. In this way, by varying tL with respect to tP, it should be possible to observe the change in the Kα fluorescence as a function of the delay between tP and tL. Then, by varying the observation angle θ around the Bragg angle, one could observe the typical Kossel patterns. In particular, one expects that these Kossel patterns, which are a signature of the crystal order in the material, will vary and even disappear with bulk heating. It should be noted that this zone of structural change must be kept larger than the zone effectively excited by the hot electrons, to ensure that the Kα signature reflects the modified zone.
![]()
Figure 9.Geometry of a possible experimental setup for pump–probe Kossel diffraction experiments.
For practical reasons, the experimental setup should be such that the directions of the high-intensity laser and of the detected photons are roughly perpendicular (depending on the Bragg angle of the problem). The Kα emission must be analyzed with a convenient spectrometer positioned at the peak of the line emission, and the intensity is measured as a function of the angle θ. In fact, the resolution of the spectrometer does not need to be very high, since the goal is to record the Kα photons integrated over the line profile. In this setup, a variation (indicated by the rotation axis) of the exit angle θ must be allowed around the Bragg angle with an uncertainty of less than about 0.01° for a good angular resolution of Kossel structures (in crystals). Here it should be noted that the size of the Kα-emitting zone of the sample leads to a spread of the collected line emission angles over an interval that is just the angle subtended by the emitting zone of diameter D at the detector distance R. This spread leads to a geometrical broadening Δθgeom = (D/R)sin θB to be added to the intrinsic broadening Δθ due to the Kα linewidth already discussed in Sec. III A.
![]()
Figure 10.Another possible experimental setup for pump–probe
The requirements in terms of detection capabilities are as follows. Typically, for a 1 µm thick Ni target, Fig. 3 indicates a background Kα outgoing intensity of about 1 × 10¹⁸ erg cm−2 s−1 sr−1. Taking 7478 eV photons (Kα), a 20 fs pulse and an expected Kα source size of 15 µm,55 one gets a number of 3 × 10⁶ photons emitted per steradian per shot. For a thin film, Fig. 5 indicates that about 106 Kα photons sr−1 per shot can be expected. These numbers are well above current detection capabilities of typically 105 photons sr−1 per shot55 using the photon counting method in which an x-ray CCD camera acts as a dispersive spectrometer.56 This detection capability is obtained by accumulation over a few hundred shots by using a moving target allowing refreshment of the interaction zone with the laser before each shot. Note also that the requirement of a resolution dθ of about 0.01° with a given pixel size sp for the detector imposes a minimum distance R = sp/tan(dθ) between the detector and the Kα-emitting zone. For a typical pixel size of 100 µm, the detector should be positioned at R = 60 cm. Under these conditions the geometric broadening Δθgeom remains negligible compared with the intrinsic broadening Δθ (even with a Kα-emitting zone much larger than a laser focal spot of a few square micrometers). This geometry raises the question of the optimum thickness e of the probed material (see Fig. 9). Indeed, hot electrons produced at its surface must pass through the whole sample while retaining enough energy for K-shell ionization of the sample. While the conversion efficiency η and hot-electron temperature kTh do not seem to depend on the Z of the material, transport of these hot electrons does. For a mid-Z element like molybdenum, it is known that hot electrons produced by highly intense laser pulses (IL ∼ 1019 W/cm2) do not travel more than about 4 µm55 (and probably less than that) owing to the collective effects mentioned above (Sec. II A 2). Lighter elements are likely to be more easily crossed by hot electrons. On the other hand, a desirable uniform heating of the sample by the pump laser precludes a thickness of more than 100 nm. Such a thickness is likely to be fully excited by the hot electrons. Furthermore, it should be noted that the travel time of hot electrons having a typical energy of 100 keV is less than 1 fs.
A different setup is shown in Fig. 10. This geometry could be adapted to the case where the material to be studied has too large a Kα wavelength to be diffracted by its own interplanar spacings (sin θ = λ/2d > 1). The idea is to use a target layer giving a shorter Kα wavelength and to observe the sample in transmission. This is the essence of transmission Kossel diffraction.57 Here the short and intense laser beam interacts with a high-Z (with respect to the sample) solid target to produce a short burst of hot electrons and the corresponding Kα radiation. Its thickness is typically of the order of 1 µm, i.e., a compromise between hot-electron transport, Kα production, and reabsorption. Behind this target is placed the sample to be analyzed and subjected to this Kα radiation flux. In situations where the thermodynamics of the sample must be adequately prepared by another pump laser, its thickness cannot go over about 100 nm for reasons given above. These two layers can conveniently be deposited on a substrate (glass) that is assumed to be transparent both to the pump laser (of low intensity) and to the Kα radiation (hard x-rays). It should be noted that by its geometry, the Kα-emitting layer also prevents any significant perturbation of the sample by the hot electrons.
In both schemes, the angle of incidence of the high-intensity laser beam on the target matters, since the mechanisms responsible for the hot-electron production depend on this angle. However, for a given choice of incident angle, one does not expect any significant change in hot-electron production over an angular interval of less than 1° around this angle. If one chooses to keep the position of the detector constant and to vary the angle of the target, then this small interval is more than enough for the complete recording of a Kossel pattern emitted by a crystal material (see Figs. 3–6).
V. CONCLUSION
Time-resolved Kossel diffraction has been shown to be a potential interesting technique for providing information on structural order in materials. The observation of Kossel features around the Bragg angle is a signature of the periodic arrangement of atoms in a material. The method consists in performing an angular scan of the Kα fluorescence emission induced by energetic particles (electrons or photons) crossing and ionizing inner atomic shells in a given material. As an alternative to XFEL photon bursts, the interaction of a short and intense laser pulse with a solid may provide short bursts of energetic electrons of a few tens of femtoseconds, which, through the observation of Kossel features, could permit structural dynamics to be followed in a sample that has been well prepared (at an earlier time than the source), provided that the evolution time of the material is longer than about 0.1–1 ps. Such studies require variation of the delay between the source of hot electrons (i.e., the intense laser pulse) and the pump preparing the sample. This approach could provide a new tool to obtain information concerning the characteristic evolution times of structural order in a material previously excited by some external means. While much work remains to be done to master Kossel pattern detection under extreme conditions, let us emphasize again the possibility of phase retrieval with this technique. This unique aspect alone makes ultrafast Kossel diffraction worth examining.
ACKNOWLEDGMENTS
Acknowledgment. The author thanks Philippe Jonnard and Jean-Michel André (LCPMR, Sorbonne University) as well as Marc Sentis, Raphaël Clady, and Olivier Uteza (LP3, Aix-Marseille University) for helpful discussions or comments, especially about current experimental capabilities.
References
[1] T.Elsaesser, M.Woerner. Perspective: Structural dynamics in condensed matter mapped by femtosecond x-ray diffraction. J. Chem. Phys., 140, 020901(2014).
[2] F.Dorchies, V.Recoules. Non-equilibrium solid-to-plasma transition dynamics using XANES diagnostic. Phys. Rep., 657, 1(2016).
[3] J.-C.Gauthier, C.Rischel, A.Rousse. Femtosecond x-ray crystallography. Rev. Mod. Phys., 73, 17(2001).
[4] C.Blome, J.Blums, K.Sokolowski-Tinten et al. Femtosecond X-ray measurement of coherent lattice vibrations near the Lindemann stability limit. Nature, 422, 287(2003).
[5] M.Bargheer, Y.Gritsai, N.Zhavoronkov et al. Coherent atomic motions in a nanostructure studied by femtosecond x-ray diffraction. Science, 306, 1771(2004).
[6] J.Larsson, A. M.Lindenberg, K.Sokolowski-Tinten et al. Atomic-scale visualization of inertial dynamics. Science, 308, 392(2005).
[7] B.Adams, D. M.Fritz, D. A.Reis et al. Ultrafast bond softening in bismuth: Mapping a solid’s interatomic potential with x-rays. Science, 315, 633(2007).
[8] P.Beaud, S. L.Johnson, A.Streun et al. Spatiotemporal stability of a femtosecond hard x-ray undulator source studied by control of coherent optical phonons. Phys. Rev. Lett., 99, 174801(2007).
[9] Y.Azamoum, R.Clady, A.Ferré, M.Gambari, M.Sentis, O.Utéza. High photon flux
[10] M.Afshari, P.Krumey, D.Menn et al. Time-resolved diffraction with an optimized short pulse laser plasma X-ray source. Struct. Dyn., 7, 014301(2020).
[11] C.Hauf, M.Holtz, J.Weisshaupt et al. Towards shot-noise limited diffraction experiments with table-top femtosecond hard x-ray sources. Struct. Dyn., 4, 054304(2017).
[12] U.Bergmann, P.Glatzel. High resolution 1s core hole X-ray spectroscopy in 3d transition metal complexes—electronic and structural information. Coord. Chem. Rev., 249, 65(2005).
[13] W.Kossel, V.Loeck, H.Voges. Die richtungsverteilung der in einem kristall entstandenen charakteristischen röntgenstrahlung. Z. Phys., 94, 139(1935).
[14] D.Bahr, T.Gog, G.Materlik. Kossel diffraction in perfect crystals: X-ray standing waves in reverse. Phys. Rev. B, 51, 6761(1995).
[15] J. P.Hannon, J. T.Hutton, G. T.Trammell. Determining the phase of the structure factor by Kossel cone analysis with the use of synchrotron radiation. Phys. Rev. B, 31, 743(1985).
[16] G.Bortel, A.Chumakov, G.Faigel, M.Tegze. Measurement of synchrotron-radiation-excited Kossel patterns. J. Synchrotron Radiat., 23, 214(2016).
[17] G.Bortel, G.Faigel, M.Tegze. Experimental phase determination of the structure factor from Kossel line profile. Sci. Rep., 6, 22904(2016).
[18] B.Adams, T.Hiort, D. V.Novikov et al. X-ray holography for structural imaging. J. Synchrotron Radiat., 5, 315(1998).
[19] B.Adams, T.Hiort, E.Kossel, G.Materlik, D. V.Novikov. Atomic holography with x-rays. Phys. Rev. B, 57, 7526(1998).
[20] A.Sz?ke. X-ray and electron holography using a local reference beam. AIP Conf. Proc., 147, 361(1986).
[21] G.Faigel, M.Tegze. Atomic-resolution x-ray holography. Europhys. Lett., 16, 41(1991).
[22] G.Faigel, M.Tegze. X-ray holography with atomic resolution. Nature, 380, 49(1996).
[23] K.Hayashi, P.Korecki. X-ray fluorescence holography: Principles, apparatus, and applications. J. Phys. Soc. Jpn., 87, 061003(2018).
[24] W.Kossel. Bemerkung zur scheinbaren selektiven reflexion von röntgenstrahlen an kristallen. Z. Phys., 23, 278(1924).
[25] S.D?britz, E.Langer. 75 years of Kossel patterns—Past and future. IOP Conf. Ser.: Mater. Sci. Eng., 7, 012015(2010).
[26] F.Bridou, J. P.Chauvineau. Analyse angulaire de la fluorescence du fer dans une multicouche périodique Fe/C. J. Phys. IV France, 6, C7-53(1996).
[27] J.-M.André, C.Bonnelle, F.Bridou, P.Jonnard, B.Pardo. Modulation of x-ray line intensity emitted by a periodic structure under electron excitation. Appl. Phys. Lett., 81, 1524(2002).
[28] J.-M.André, C.Bonnelle, F.Bridou, P.Jonnard, B.Pardo. Soft-x-ray Kossel structures from W/C multilayers under various electron ionization conditions. Phys. Rev. A, 68, 032505(2003).
[29] J.-M.André, K. L.Guen, M.Wu et al. Kossel effect in periodic multilayers. J. Nanosci. Nanotechnol., 19, 593(2019).
[30] J.-M.André, P.Jonnard, K.Le Guen, O.Peyrusse. X-ray emission from layered media irradiated by an x-ray free-electron laser. Phys. Rev. A, 101, 013818(2020).
[31] V.Honkim?ki, N.Perez-Bocanegra, M.Sanchez del Rio, X.Shi, L.Zhang. Simulation of X-ray diffraction profiles for bent anisotropic crystals. J. Appl. Crystallogr., 48, 477(2015).
[32] R. J.Dejus, M.Sanchez del Rio. Status of XOP: An x-ray optics software toolkit. Proc. SPIE, 5536, 171(2004).
[33] R. J.Dejus, M.Sánchez del Río. XOP v2.4: Recent developments of the x-ray optics software toolkit. Proc. SPIE, 8141, 814115(2011).
[34] O.Brümmer, W.Schülke. Vergleichende untersuchungen von interferenzen bei kohärenter und inkohärenter lage der röntgen-strahlenquelle zum kristallgitter. Z. Naturforsch., A, 17, 208(1962).
[35] M.Born, E.Wolf. Principles of Optics(1975).
[36] J. M.André, J.Gaudin, P.Jonnard, O.Peyrusse. Modeling of the interaction of an x-ray free-electron laser with large finite samples. Phys. Rev. E, 96, 043205(2017).
[37] E. W.Larsen, C. L.Leakeas. Generalized Fokker-Planck approximations of particle transport with highly forward-peaked scattering. Nucl. Sci. Eng., 137, 236(2001).
[39] D.Batani, A.Morace, J. J.Santos, L.Volpe. Collisional and collective effects in two dimensional model for fast-electron transport in refluxing regime. Phys. Plasmas, 20, 013104(2013).
[40] W. L.Kruer, A. B.Langdon, M.Tabak, S. C.Wilks. Absorption of ultra-intense laser pulses. Phys. Rev. Lett., 69, 1383(1992).
[41] M.Sherlock. Universal scaling of the electron distribution function in one-dimensional simulations of relativistic laser-plasma interactions. Phys. Plasmas, 16, 103101(2009).
[42] Z.Jiang, J. C.Kieffer, A.Krol, J.Yu. Hard x-ray emission in high intensity femtosecond laser–target interaction. Phys. Plasmas, 6, 1318(1999).
[43] R.Betti, J. R.Davies, P. M.Nilson, A. A.Solodov. Copper K-shell emission cross sections for laser–solid experiments. Phys. Plasmas, 20, 083118(2013).
[44] C.Hombourger. An empirical expression for K-shell ionization cross section by electron impact. J. Phys. B: At. Mol., Opt. Phys., 31, 3693(1998).
[45] J.Bremer, H.Sorum. High-resolution studies of the K emission spectra of nickel. J. Phys. F: Met. Phys., 12, 2721(1982).
[46] J. P.Cline, A.Henins, L. T.Hudson, M. H.Mendenhall, C. I.Szabo. The molybdenum K-shell emission spectrum. J. Phys. B: At. Mol., Opt. Phys., 52, 215004(2019).
[47] P.Beaud, S. L.Johnson, C. J.Milne et al. Nanoscale depth-resolved coherent femtosecond motion in laser-excited bismuth. Phys. Rev. Lett., 100, 155501(2008).
[48] R. P.Gupta, S.Pal. Phonon dispersion relations in nickel. Solid State Commun., 4, 83(1966).
[49] M.Nicoul, U.Shymanovich, K.Sokolowski-Tinten, A.Tarasevitch, D.von der Linde. Picosecond acoustic response of a laser-heated gold-film studied with time-resolved x-ray diffraction. Appl. Phys. Lett., 98, 191902(2011).
[50] T.Dekorsy, S.DeSilvestri, M.F?rst, S.DeSilvestri, G.Cerullo, G.Lanzano and, G.Cerullo, S.DeSilvestri, G.Cerullo, G.Lanzano and, G.Lanzano. Coherent Vibrational Dynamics, 129(2008).
[51] M.Herzog, A. A.Maznev, J.Pudell et al. Layer specific observation of slow thermal equilibration in ultrathin metallic nanostructures by femtosecond X-ray diffraction. Nat. Commun., 9, 3335(2018).
[52] P. M.Anglade, J.Clérouin, S.Mazevet, V.Recoules, G.Zérah. Effect of intense laser irradiation of the lattice stability of semiconductors and metals. Phys. Rev. Lett., 96, 055503(2006).
[53] S. L.Daraszewicz, Y.Giret, N.Naruse et al. Structural dynamics of laser-irradiated gold nanofilms. Phys. Rev. B, 88, 184101(2013).
[54] V.Celli, Z.Lin, L. V.Zhigilei. Electron-phonon coupling and electron heat capacity of metals under conditions of strong electron-phonon nonequilibrium. Phys. Rev. B, 77, 075133(2008).
[55] R.Clady, M.Gambari, L.Videau et al. Experimental investigation of size broadening of a K
[56] N.Arazam, C.Bonte, C.Fourment et al. Broadband, high dynamics and high resolution charge coupled device-based spectrometer in dynamic mode for multi-keV repetitive x-ray sources. Rev. Sci. Instrum., 80, 083505(2009).
[57] S. P.Bellier, R. D.Doherty. The structure of deformed aluminium and its recrystallization—Investigations with transmission Kossel diffraction. Acta Metall., 25, 521(1977).


Set citation alerts for the article
Please enter your email address

© Copyright 2018-2021 | Chinese Laser Press. All Rights Reserved 沪ICP备15018463号-20