
Peng Xu, Haijun Zhang, Keqi Zhang, Lei Mao, Yuanfang Qiu, Jufeng Zhao. Optimization of Colorimetric Characterization Target for Color Digital Cameras Based on Uniform Color Samples[J]. Acta Optica Sinica, 2021, 41(11): 1133001
- Acta Optica Sinica
- Vol. 41, Issue 11, 1133001 (2021)
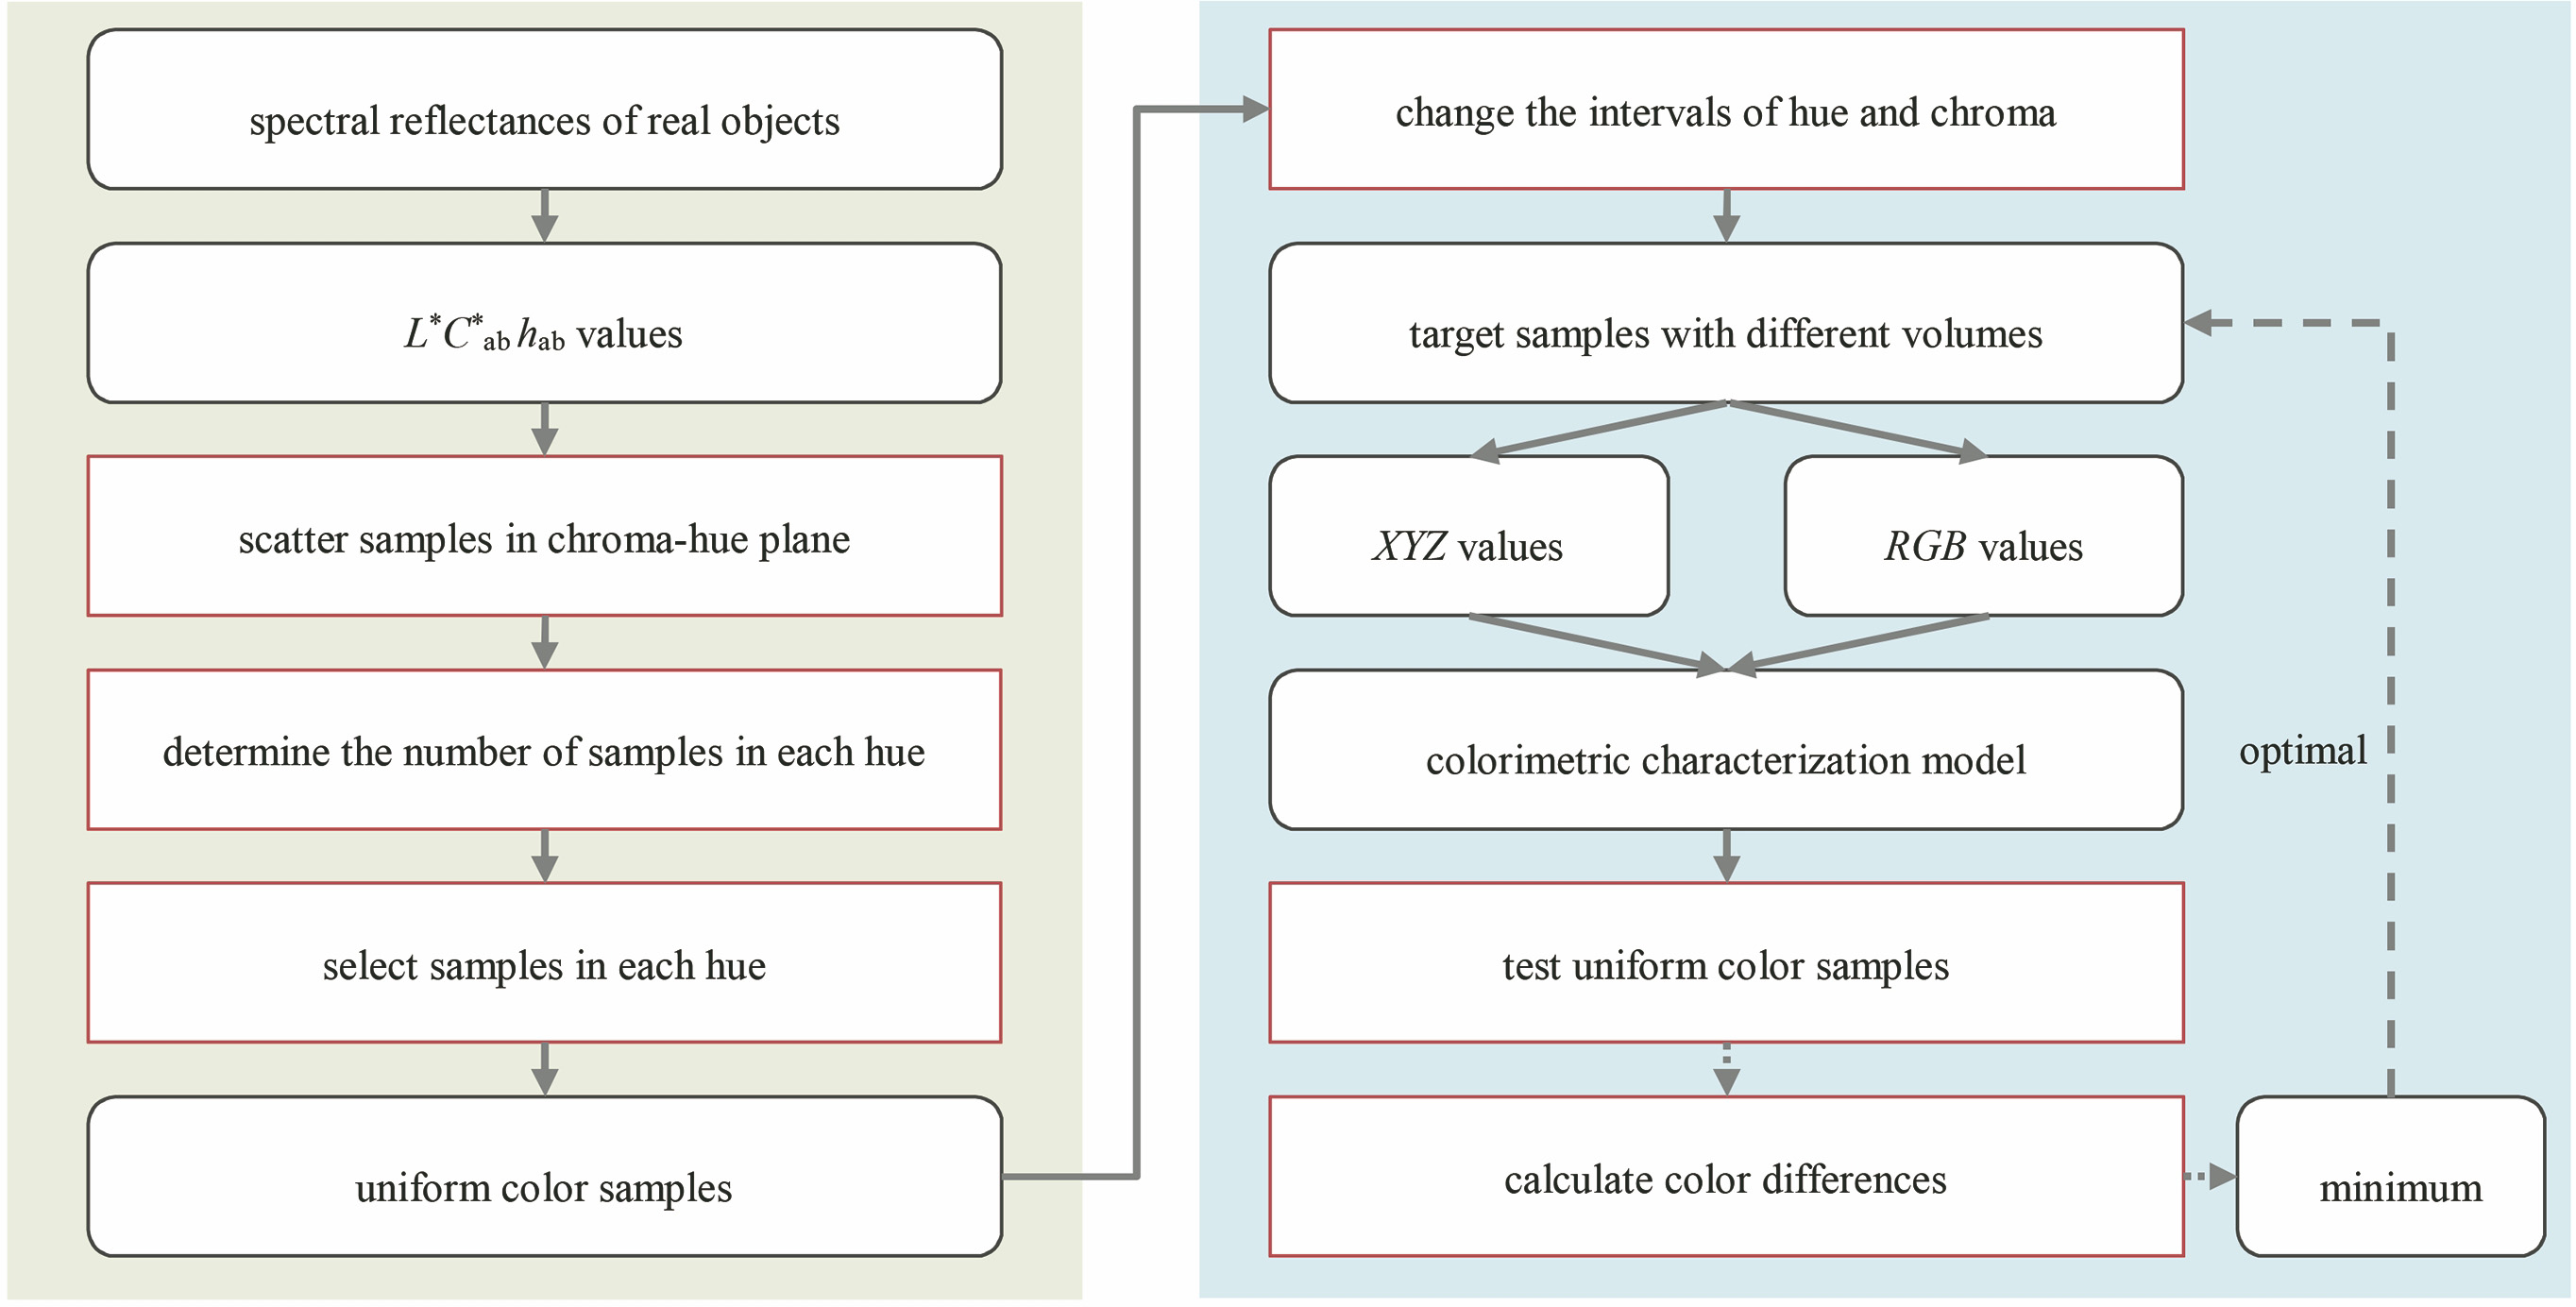
Fig. 1. Flowchart of optimizing target samples. (a) Selection of uniform color samples; (b) optimization of target samples
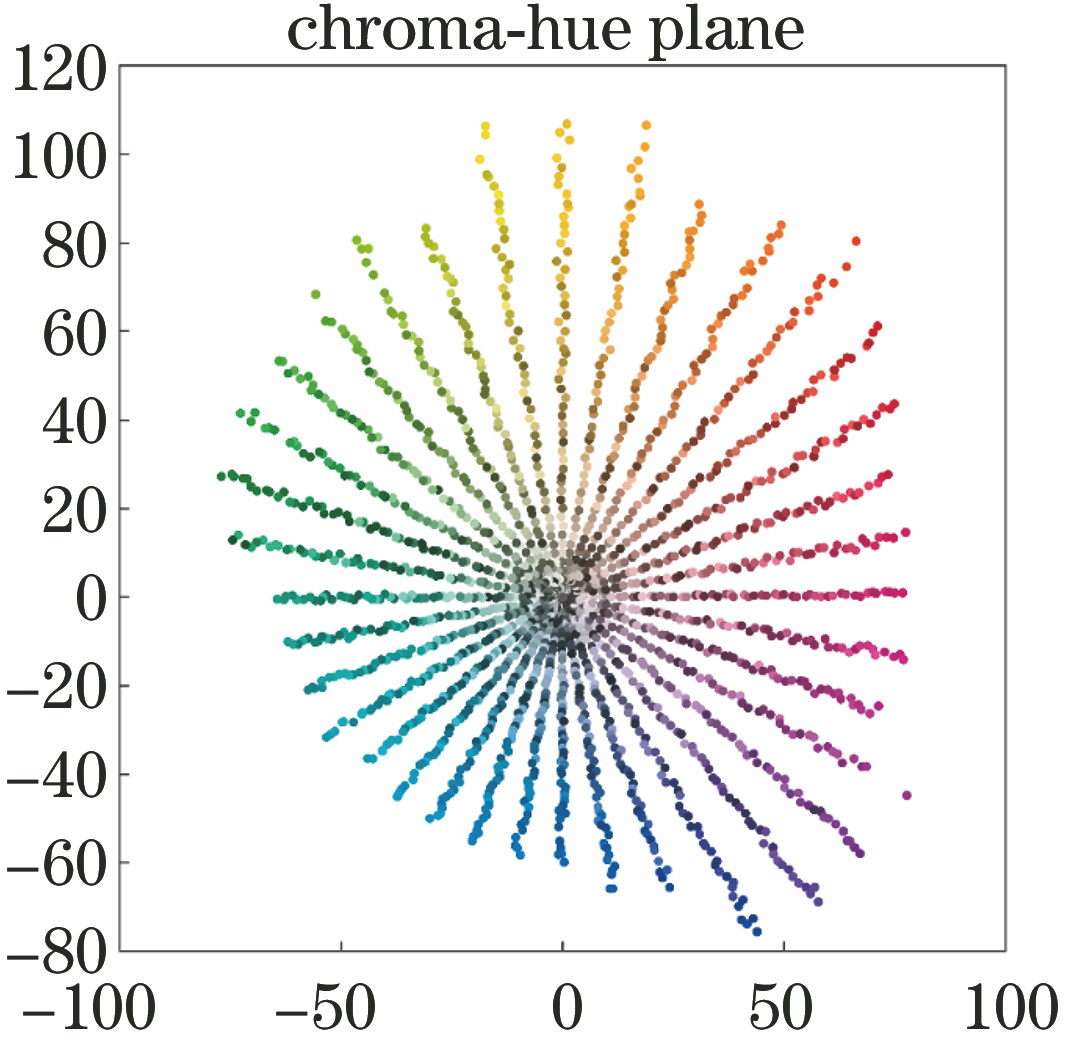
Fig. 2. Uniform color samples
Fig. 3. General spectral sensitivities of digital color cameras
Fig. 4. Optimized target samples with RAW data. (a) Optimized target samples based on linear characterization model; (b)--(f) optimized target samples based on polynomial colorimetric characterization model with different terms, and the number of terms is 5, 6, 8, 9, and 11, respectively
Fig. 5. Optimized target samples based on sRGB values and polynomial colorimetric characterization models. (a)--(e) Optimized target samples based on polynomial colorimetric characterization model with different terms, and the number of terms is 5, 6, 8, 9, and 11, respectively
Fig. 6. Color difference maps of the recovered colorimetric images with two targets respectively. (a) Original image represented by sRGB image; (b) color difference map of the recovered colorimetric image with DC target; (c) color difference map of the recovered colorimetric image with P11 target
|
Table 1. Number of optimized target samples with RAW data
| ||||||||||||||||||||||||||||||||||||||||||||||||||||||||||||||||
Table 2. Accuracy of colorimetric characterization for different target samples with RAW data
|
Table 3. Number of optimized target samples with sRGB data
| ||||||||||||||||||||||||||||||||||||||||||||
Table 4. Accuracy of colorimetric characterization for different target samples based on sRGB data

Set citation alerts for the article
Please enter your email address
© Copyright 2018-2021 | Chinese Laser Press. All Rights Reserved 沪ICP备15018463号-20