• Acta Optica Sinica
  • Vol. 38, Issue 8, 0811004 (2018)
Yan Chen1、2、*, Zhongliang Li1、2, Nan Nan1, Yang Bu1、2, Xuan Wang1、2, Liuhua Pan1、2, and Xiangzhao Wang1、2、*
Author Affiliations
  • 1 Laboratory of Information Optics and Opto-Electronic Technology, Shanghai Institute of Optics and Fine Mechanics, Chinese Academy of Sciences, Shanghai 201800, China
  • 2 University of Chinese Academy of Sciences, Beijing 100049, China
  • show less
    DOI: 10.3788/AOS201838.0811004 Cite this Article Set citation alerts
    Yan Chen, Zhongliang Li, Nan Nan, Yang Bu, Xuan Wang, Liuhua Pan, Xiangzhao Wang. Speckle Noise Reduction in Fourier Domain Polarization-Sensitive Coherence Tomography by Split-Spectrum[J]. Acta Optica Sinica, 2018, 38(8): 0811004 Copy Citation Text show less
    Diagram of split-spectrum method for speckle noise reduction
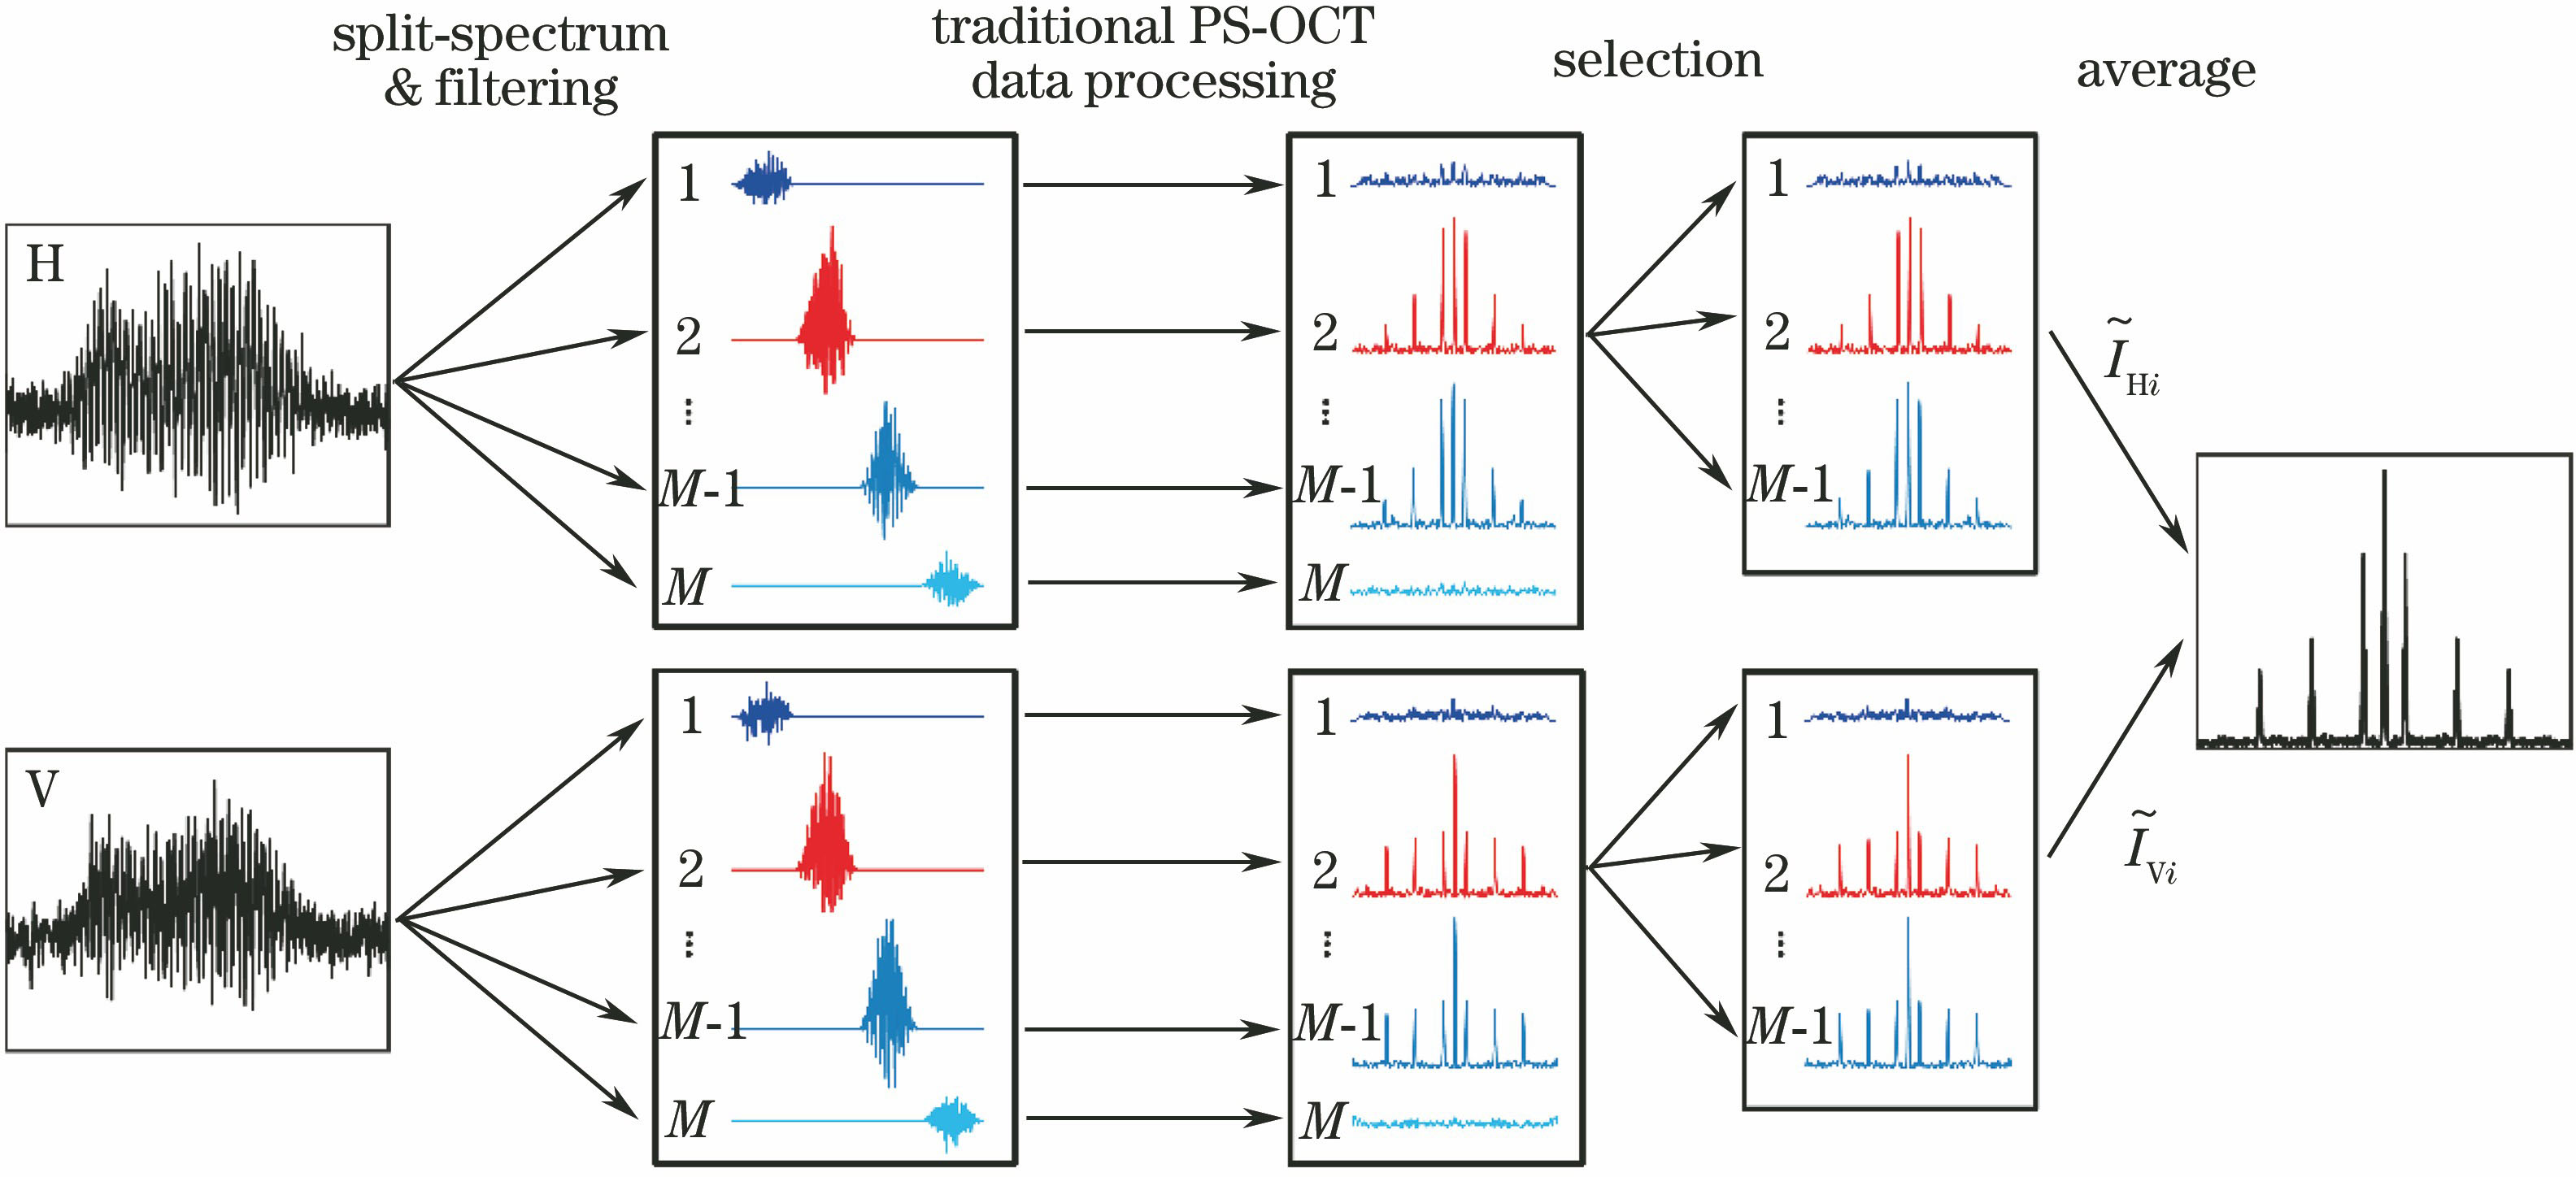
    Fig. 1. Diagram of split-spectrum method for speckle noise reduction
    Power spectrum of light source
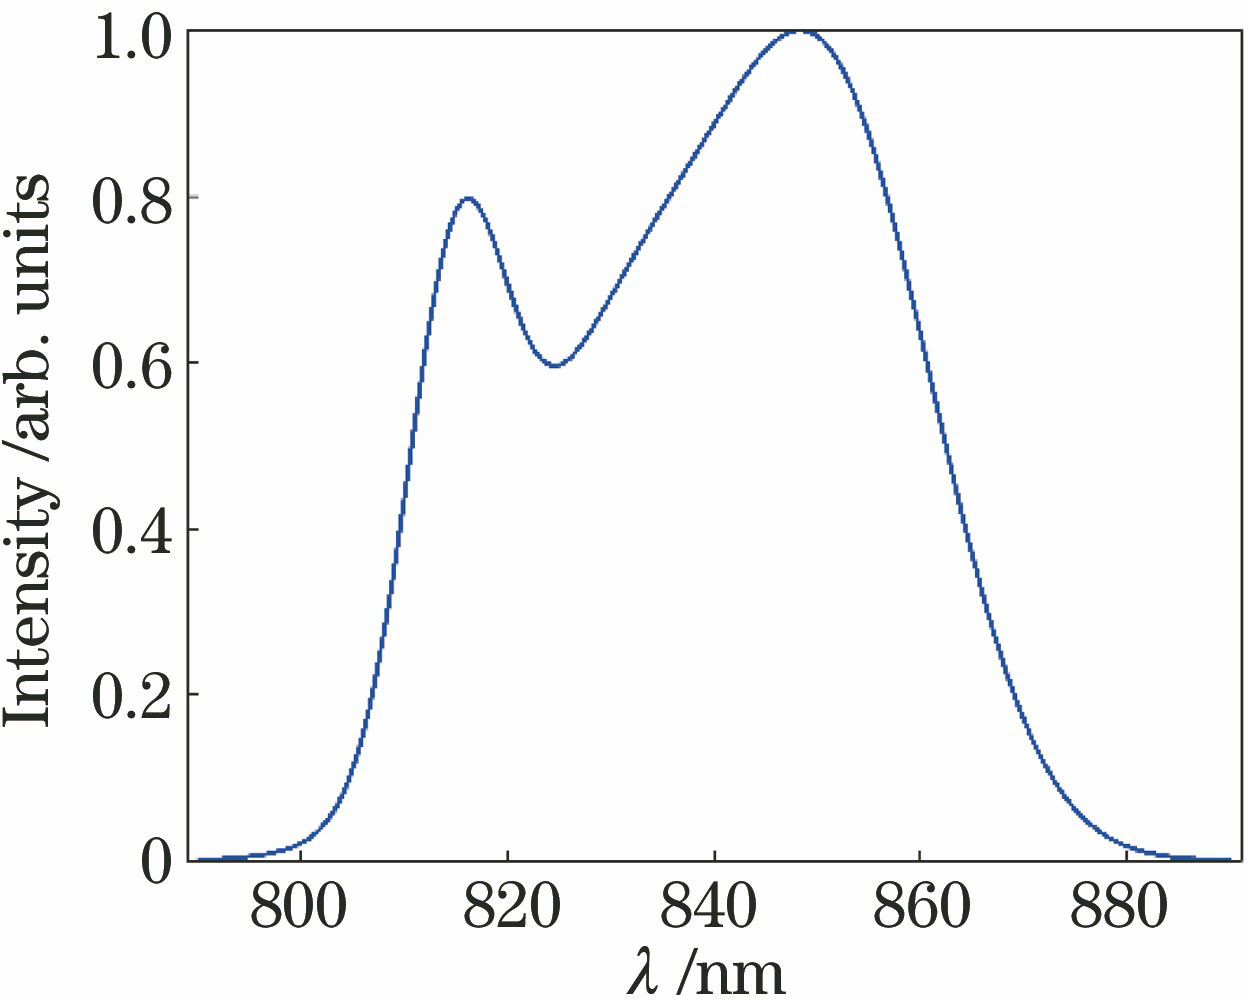
    Fig. 2. Power spectrum of light source
    Simulation results of intensity images. (a) Before split-spectrum; (b) method 1; (c) method 2
    Fig. 3. Simulation results of intensity images. (a) Before split-spectrum; (b) method 1; (c) method 2
    Simulation results of the polarization images. Retardation images, (a) before split-spectrum, (c) method 1, (e) method 2; fast axis orientation images, (b) before split-spectrum, (d) method 1, (f) method 2
    Fig. 4. Simulation results of the polarization images. Retardation images, (a) before split-spectrum, (c) method 1, (e) method 2; fast axis orientation images, (b) before split-spectrum, (d) method 1, (f) method 2
    Comparison of A-line signals before and after using the split-spectrum method. (a) Whole result; (b) enlarged view of dashed box in Fig.(a)
    Fig. 5. Comparison of A-line signals before and after using the split-spectrum method. (a) Whole result; (b) enlarged view of dashed box in Fig.(a)
    Schematic of FD-PS-OCT system
    Fig. 6. Schematic of FD-PS-OCT system
    PS-OCT images of chicken breast muscle. (a)(b) Intensity images before and after using the split-spectrum method; (c)(d) retardation images before and after using the split-spectrum method; (e)(f) fast axis orientation images before and after using the split-spectrum method
    Fig. 7. PS-OCT images of chicken breast muscle. (a)(b) Intensity images before and after using the split-spectrum method; (c)(d) retardation images before and after using the split-spectrum method; (e)(f) fast axis orientation images before and after using the split-spectrum method
    MethodRegion 1(mean±SD)Region 2(mean±SD)
    Beforesplit-spectrum0.9871±7.22631.0296±7.1374
    Method10.0569±1.13690.0333±0.7567
    Method20.0264±0.52020.0104±0.3480
    Table 1. Comparison of speckle reduction of 2 methods in intensity images
    MethodRegion 1 (mean±SD) /radRegion 2 (mean±SD) /rad
    Before split-spectrum0.0191±0.12870.0226±0.1457
    Method 10.0031±0.05350.0021±0.0466
    Method 20.0032±0.05250.0011±0.0305
    Table 2. Comparison of speckle reduction of two methods in retardation images
    MethodRegion 1 (mean±SD) /radRegion 2 (mean±SD) /rad
    Before split-spectrum0.0209±0.15180.0225±0.1486
    Method 10.0015±0.03200.0023±0.0453
    Method 20.0032±0.05350.0008±0.0222
    Table 3. Comparison of speckle reduction of two methods in fast axis orientation images
    MethodIntensity (mean±SD)Retardation(mean±SD) /radFast axis orientation(mean±SD) /rad
    Before split-spectrum129.5587±64.88790.4002±0.31560.6450±0.5139
    Method 2148.4446±33.48840.6437±0.20450.7774±0.2732
    Table 4. Comparison of speckle reduction in PS-OCT images before and after split-spectrum method
    ItemMethodSNR /dBCNRENL
    RBefore split-spectrum26.16511.00202.1539
    Method 227.61801.75577.5866
    Improvement1.45291.75223.5223
    δBefore split-spectrum18.23180.76641.4162
    Method 220.81181.46515.5352
    Improvement2.58001.91173.9085
    θBefore split-spectrum18.02500.70331.0144
    Method 220.81231.30653.9362
    Improvement2.78731.85773.8803
    Table 5. SNR, CNR and ENL for PS-OCT images before and after using split-spectrum method
    Yan Chen, Zhongliang Li, Nan Nan, Yang Bu, Xuan Wang, Liuhua Pan, Xiangzhao Wang. Speckle Noise Reduction in Fourier Domain Polarization-Sensitive Coherence Tomography by Split-Spectrum[J]. Acta Optica Sinica, 2018, 38(8): 0811004
    Download Citation