
Ciwei Chen, Bin Zhou, Yangkun Zhu, Yihong Wang, Weican Liang. Synchronous Measurement Methods for Particulate Matter and Gas Concentrations[J]. Acta Optica Sinica, 2019, 39(6): 0612008
- Acta Optica Sinica
- Vol. 39, Issue 6, 0612008 (2019)
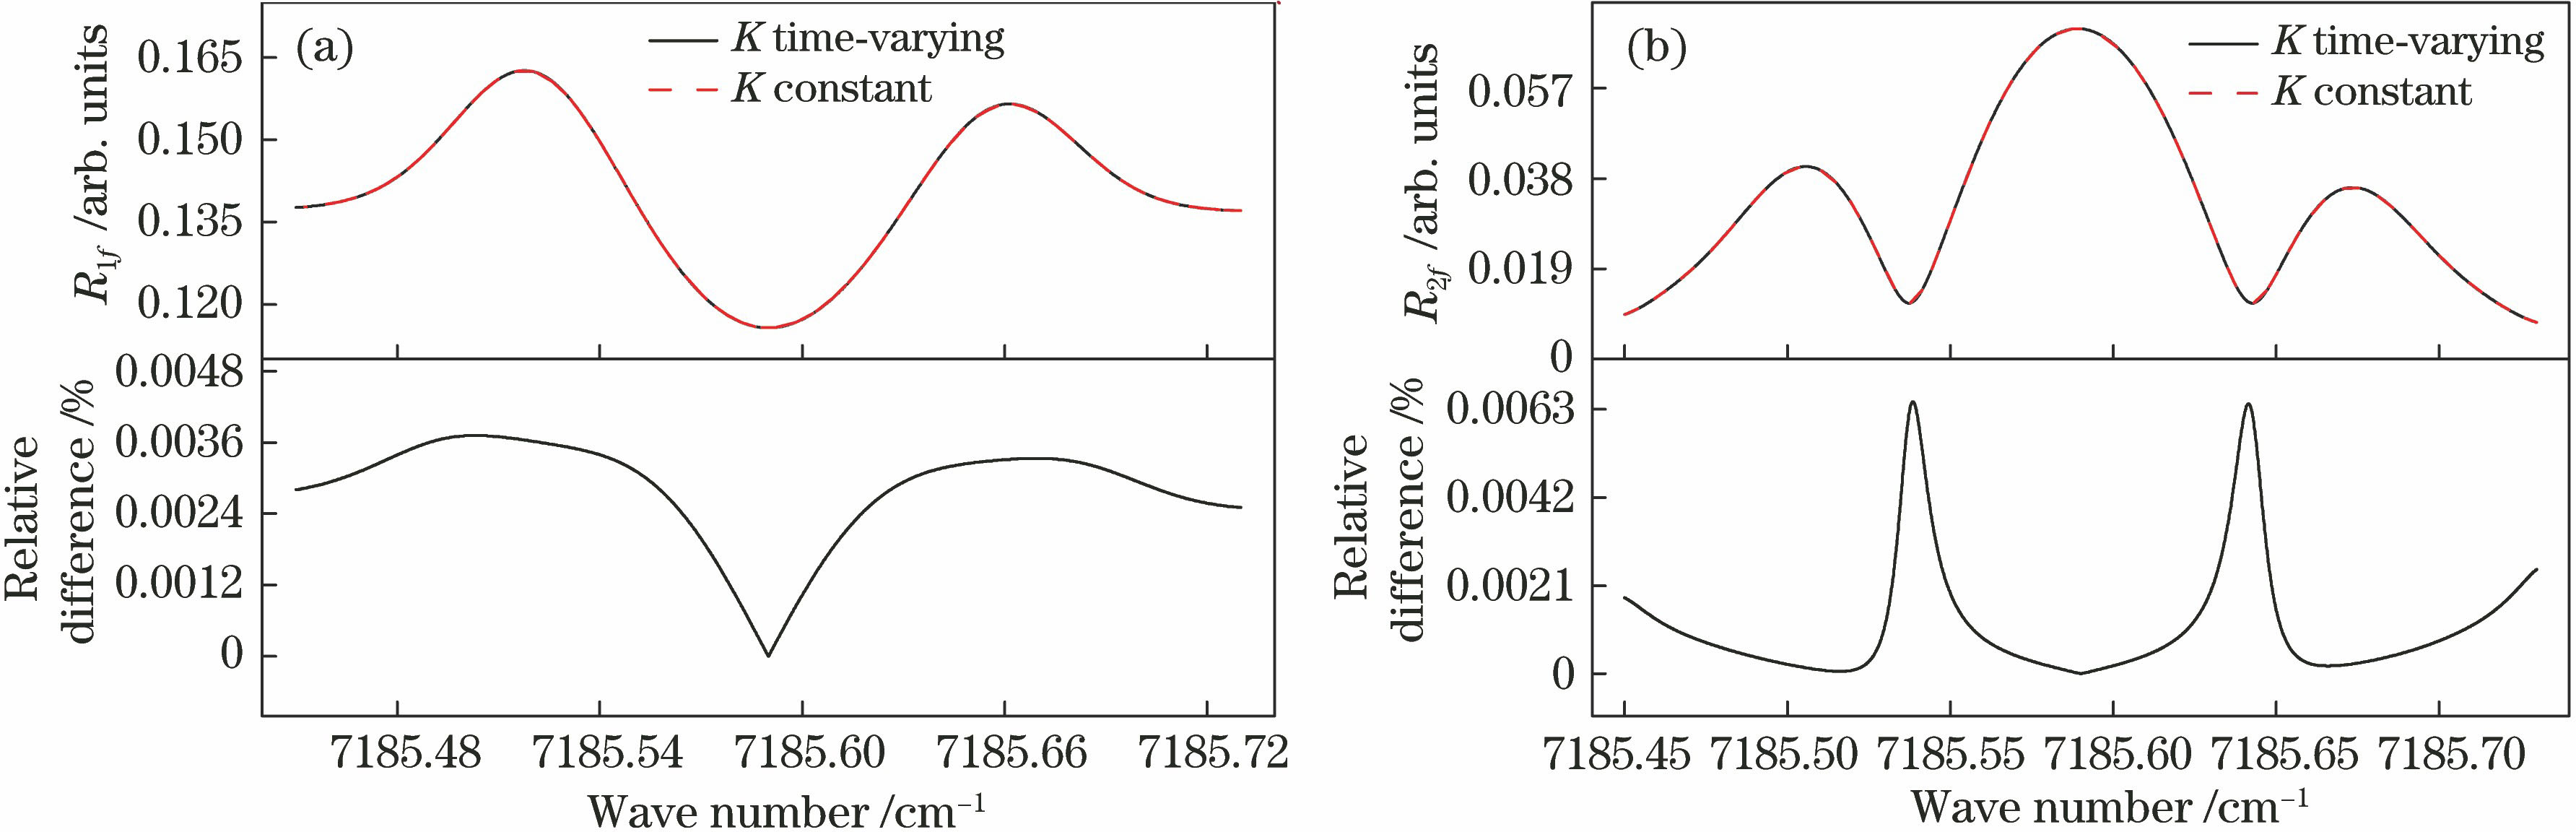
Fig. 1. Effect of scattering coefficient term on harmonic signal. (a) First harmonic signal; (b) second harmonic signal
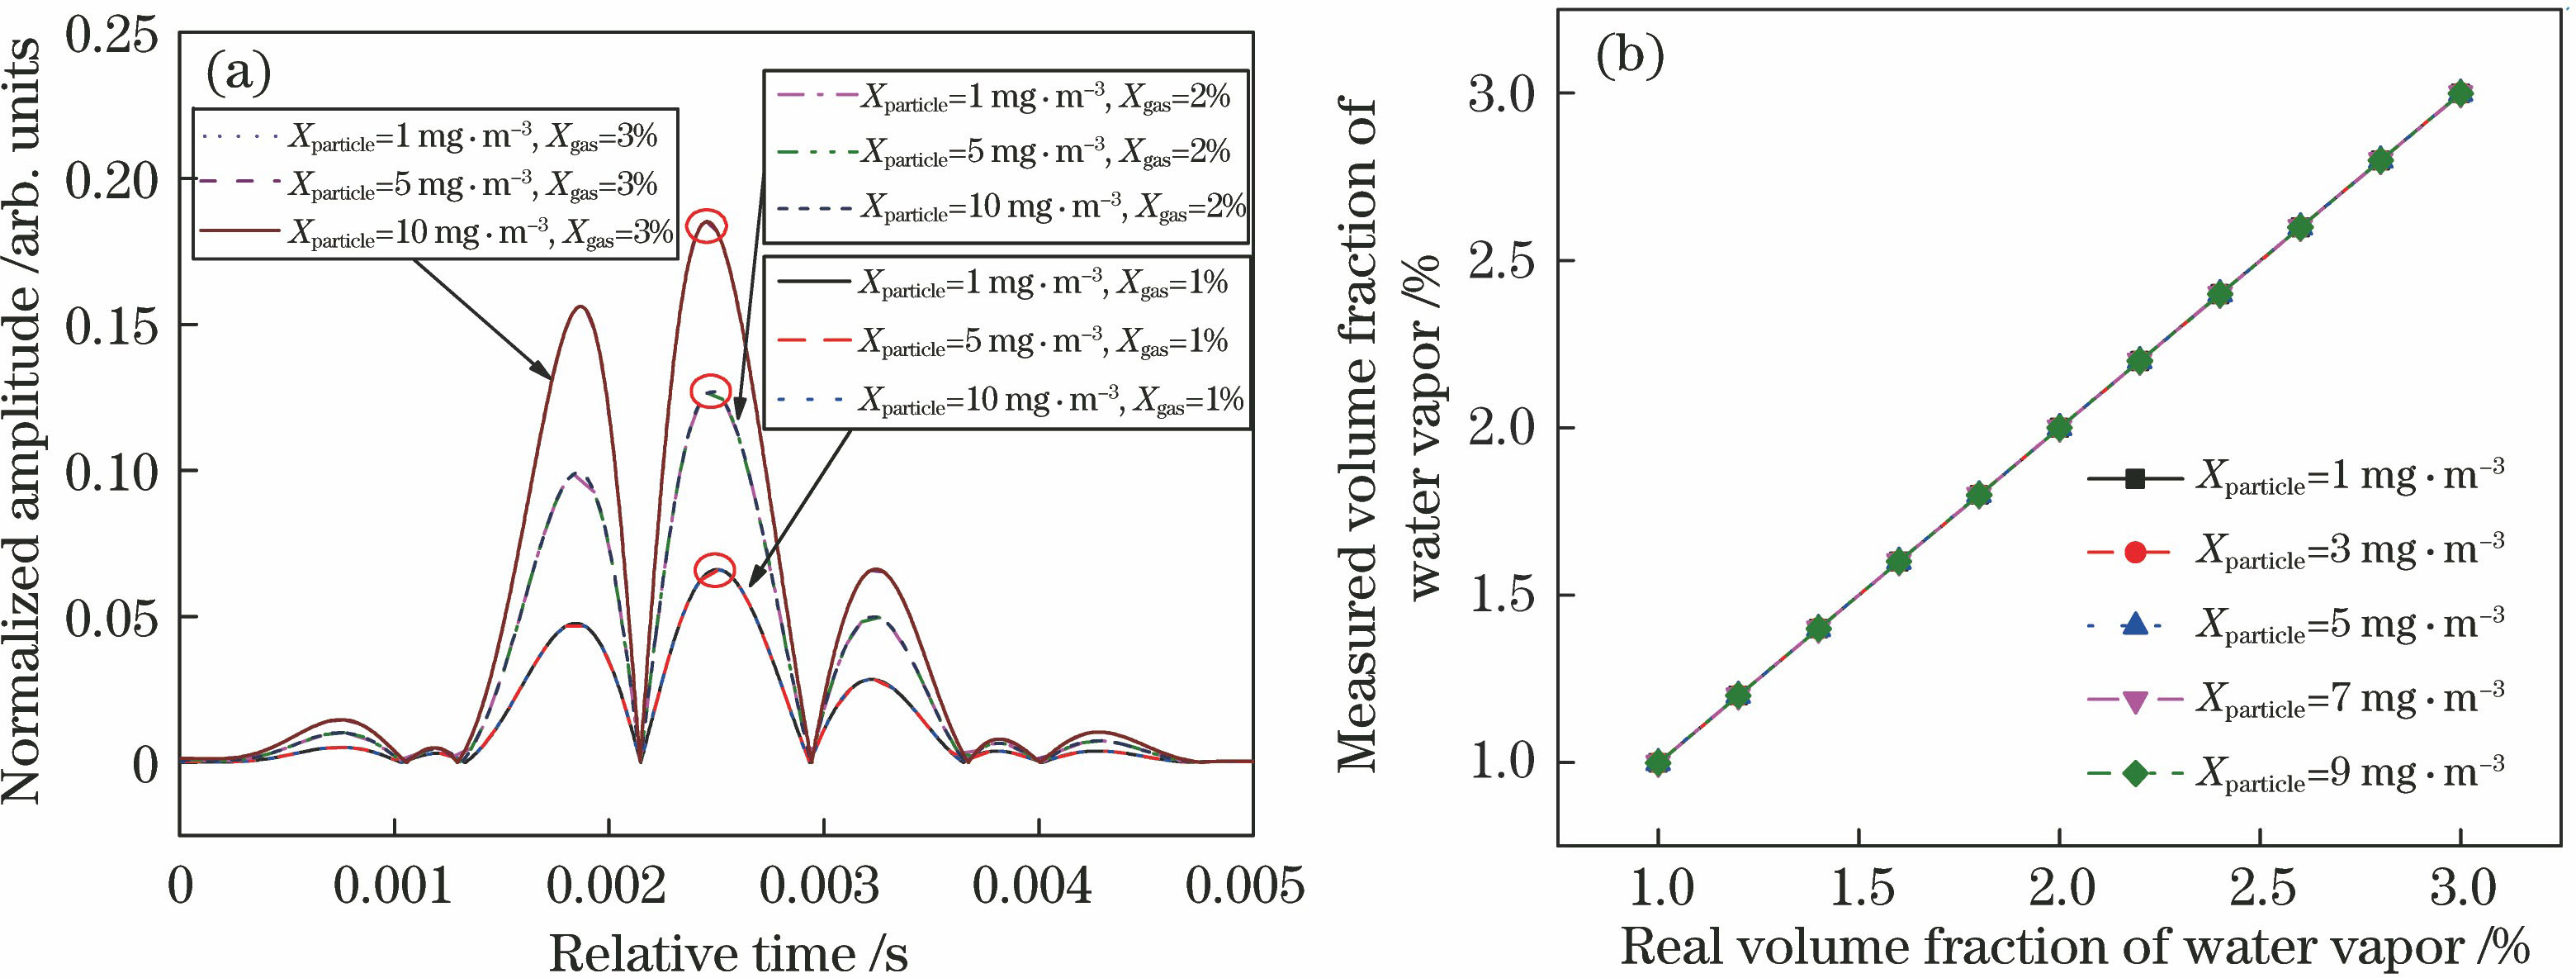
Fig. 2. Simulated signal and gas concentration. (a) Normalized second harmonic signal; (b) relationship between measured gas concentration and real concentration
Fig. 3. Simulated signal and particle concentration after eliminating gas absorption effect. (a) First harmonic amplitude; (b) relationship between the mean of amplitudes and the mass concentration of particulate matter
Fig. 4. Schematic of experimental verification system based on light intensity modulation
Fig. 5. Measured original signal
Fig. 6. Spectrum measured by LIM
Fig. 7. Experimental measurement results. (a) First harmonic signal measured by LIM; (b) comparison of eigenvalue and value measured by dust meter
Fig. 8. Schematic of experimental system for synchronous measurement of gas and particle concentrations
Fig. 9. Experimental and verification results of WMS-LS method. (a) Normalized second harmonic amplitude; (b) comparison of water vapor volume fraction measured by WMS-LS with that by temperature-humidity sensor
Fig. 10. Amplitudes of first harmonic R1f of scattered light signals
Fig. 11. Experimental and verification results of WMS-LS method after eliminating gas absorption effect. (a) Amplitude of first harmonic; (b) comparison of mass concentration of particulate matter measured by WMS-LS with that by dust meter
|
Table 1. Measured spectroscopic parameters at 296 K
|
Table 2. Parameters for gas and particle concentration synchronously simultaneous measurement
|
Table 3. Experimental parameters for synchronous measurement of gas and particle concentrations

Set citation alerts for the article
Please enter your email address
© Copyright 2018-2021 | Chinese Laser Press. All Rights Reserved 沪ICP备15018463号-20