
Jia Houlei, Su Wen, Huang Huamei, Sun Qingyang, Jiang Guangjia, Ma Ronghua. Dynamic Change Characteristics and Its Dominant Influencing Factors of Secchi Disk Depth in Coastal and Inland Waters[J]. Acta Optica Sinica, 2018, 38(3): 301001
- Acta Optica Sinica
- Vol. 38, Issue 3, 301001 (2018)
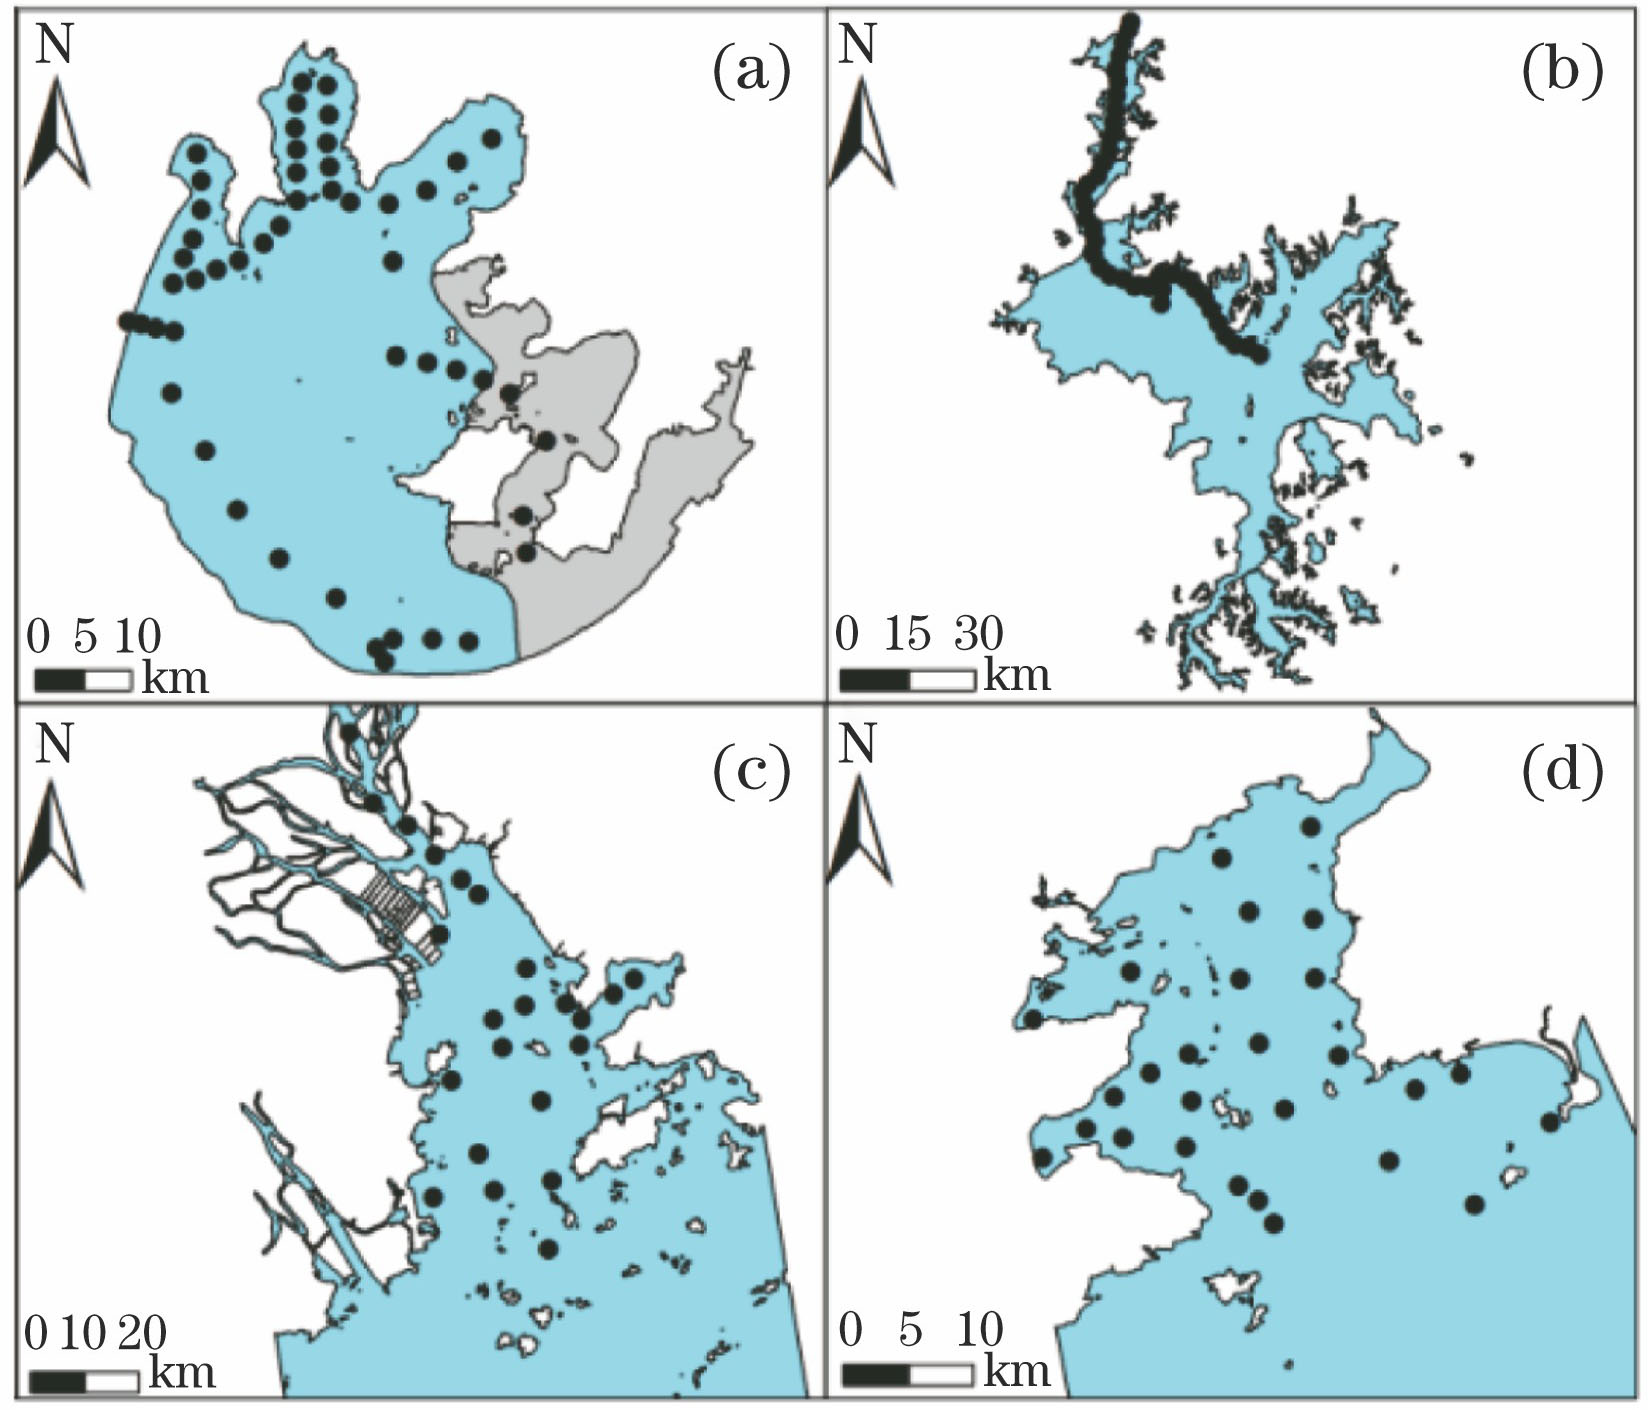
Fig. 1. Investigated waters and sample point distributions. (a) Taihu Lake; (b) Poyang Lake; (c) Pearl River Estuary; (d) Daya Bay
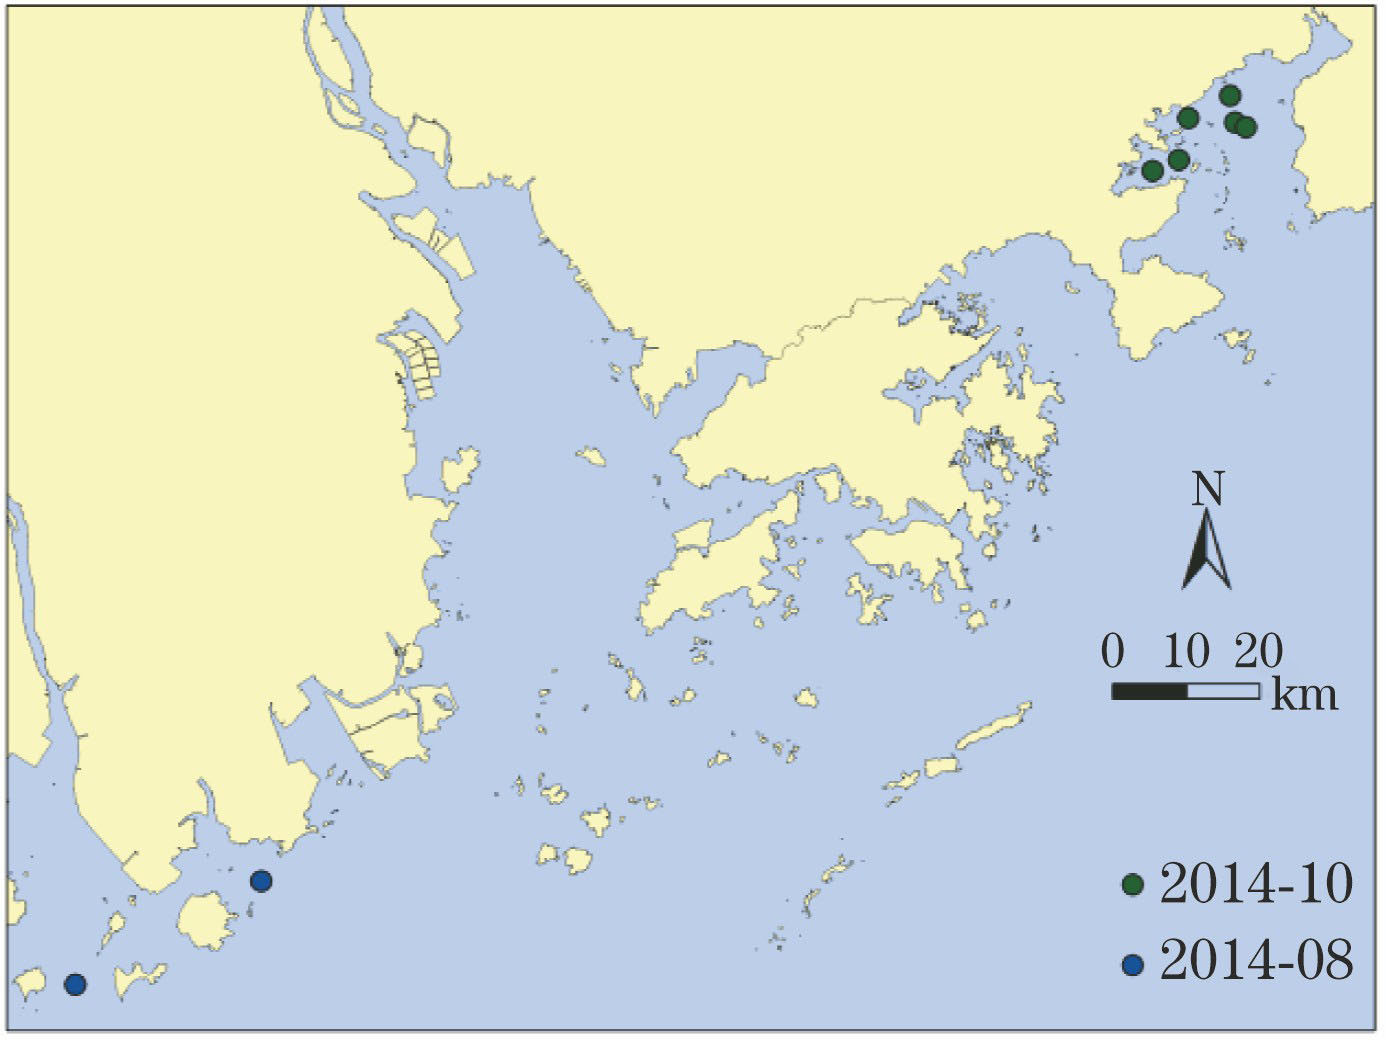
Fig. 2. Quasi-synchronization sample point distribution of remote sensing data from VIIRS satellite
Fig. 3. (a) Influence of Secchi disk depth on remote sensing reflection spectra of waters; (b) SD_H
Fig. 4. Relationship between Secchi disk depth and SD_H
Fig. 5. Relationship between measured and calculated Secchi disk depth
Fig. 6. Comparison of Secchi disk depth remote sensing evaluation models. (a) Single-band model; (b) band ratio model; (c) three-band model; (d) QAA and SD_H model
Fig. 7. (a) Comparison of measured and satellite-derived remote sensing reflectance ratio
Rrs
; (b) comparison of remote sensing reflectance spectrum and satellite remote sensing image reflectance spectrum measured at quasi-synchronous sampling points; (c) comparison of satellite remote sensing image and measured SD_H
Fig. 8. Spatial distributions of Secchi disk depth in Pearl River Estuary, Daya Bay, Taihu Lake, and Poyang Lake. (a) Satellite data evaluation results in Pearl River Estuary and Daya Bay (white represents cloud-shaded water, where the transparency is set to zero); (b) field monitoring data in Pearl River Estuary and Daya Bay; (c) satellite data evaluation result in Taihu Lake; (d) satellite data evaluation result in Poyang Lake
Fig. 9. Correlation among Secchi disk depth of investigated waters,
cTSS
,
cChla
and
aCDOM
(440). (a) Pearl River Estuary; (b) Daya Bay; (c) Taihu Lake; (d) Poyang Lake
Fig. 10. Correlation among Secchi disk depth of all sampling points, (a)
cTSS
, (b)
cChla
and (c)
aCDOM
(440)
Fig. 11. Comparison of Secchi disk depth products between VIIRS and MODIS Aqua observations on 2014-01-03 in Pearl River Estuary. (a) VIIRS; (b) MODIS
|
Table 1. Transparency remote sensing evaluation models
|
Table 2. Calculation procedure of transparency remote sensing evaluation model based on QAA
|
Table 3. Sampling information and ecological parameter statistics of waters in Taihu Lake, Poyang Lake, Pearl River Estuary, and Daya Bay
| ||||||||||||||||||||||||||||||||||||||||||||||||||||||||||||||||||||||||||||||||||||||||||||||||
Table 4. Comparison of water color band settings of VIIRS and MODIS

Set citation alerts for the article
Please enter your email address
© Copyright 2018-2021 | Chinese Laser Press. All Rights Reserved 沪ICP备15018463号-20